TVO Market Barometer 8-17: What could be bigger than the big breakout?

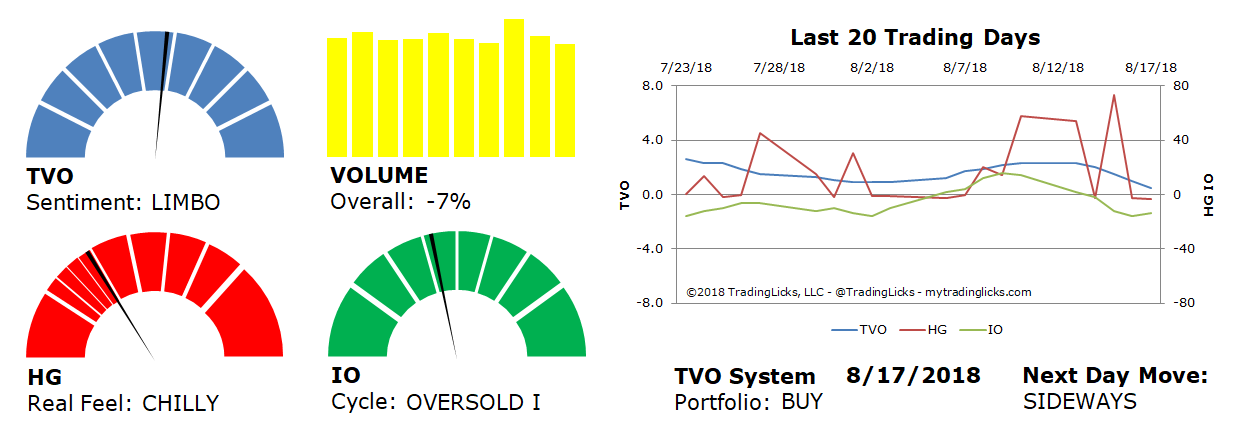
The trade wars are taking a breather, quarterly earnings may become a thing of the past and the Fed heads to Jackson Hole this week. Meanwhile, markets are soaring, but TVO, our long-term volume oscillator (that tracks big institutional moves to a “T”), is moving south towards negative values.
But how can internals be bearish when all-time highs are so close at hand? Well, simply because August has been all about distribution. The “D” word is something for bulls to look out for in the weeks ahead, but in the short-term, however, it can certainly fuel the fire, as we saw in last Wednesday’s shake-out, which certainly did its job and then some.
Our Next Day Move strategy caught the move and netted us a +25% gain on our SPY calls. This is the 8th consecutive win for the TVO System, which brings our overall account return to +9% for the year… which is just about where we were back in January before the market began unraveling.
So if we’re really picking up where we left off in January, why are we raining on the SPY 287 party? The breakout may very well be in the cards, but almost as sure as the big breakout is the even bigger pullback. Sure, it doesn’t always have to happen that way (and markets can fly higher and much longer than you’d ever expect), but since the big boys have already started clearing the decks, the bulls may want to get ready. -MD

Sentiment: LIMBO – Markets are neutral and sentiment can go either way from here.
Volume: -7% – Today’s volume was lower than the previous session.
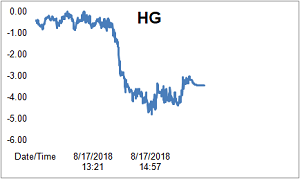
Real Feel: CHILLY – Bulls were in control of the session with substantial selling under the surface.
Cycle: OVERSOLD I – Retail investors are uncertain and very light in their holdings.
Portfolio: BUY – The market is healthy and it’s a good time to contribute to long-term investments.
Next Day Move: SIDEWAYS -Â The probability that SPY will close positive in the next session is 52%.
Want to read more? Join our list. It's free.
For the full rundown on today's active signals and options trades, please log in. Not a Member? Join us today.
To view past positions check out our Trade History.
To find out what the indicators mean, visit our Market Volume Volume Barometer.
To learn more about market volume and how we trade, find us on Twitter (@TradingLicks) and StockTwits!
The indicator descriptions in the above graphic represent general market sentiment. The actual TVO System signals and trades are listed below in the Members Area. To view, please Login. Not a Member? Join us.
