Is the dip already over or more to come? – TVO MB 2-21
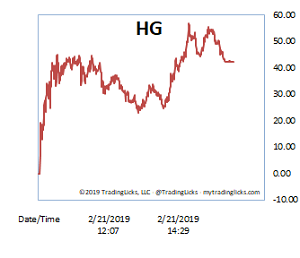
After seven straight days of CHILLY or colder temps, the Heat Gauge spent most of Thursday’s session well above zero.
You’ve often heard me say, when HG heats up, it’s time to get in the market. When it’s SWELTERING, however, it’s likely that we’ll see at least one more down day before any kind of reversal. A drop in overall volume today also adds to the probability that the bears may be just getting started.
Yes, in this case, low volume is good for the bears. But how long will it last?
You know it’s getting near the end when there’s a clear high volume spike at the extreme end of the swing… which is a pretty reliable sign that the move is exhausted. The problem with that, though, is that sometimes a seemingly exhausted move can continue a lot further than you expect.
The key is being able to recognize and take advantage of those extremes in real-time. Next Day Move (NDM) manages to do just that more than 60% of the time, in hundreds of trades spanning over the last decade.
TVO is right on the verge of entering what we refer to as the “healthy market” range. The indicator uses absolutely no price data, so it’s interesting how our portfolio “BUY” range just happens to line up with SPY reclaiming the 200 day MA.
Just an uncanny coincidence, right? Well, hardly. The study of volume will always lead you right to the door of what the big institutions are doing. All you have to do is turn the key and open it. -MD
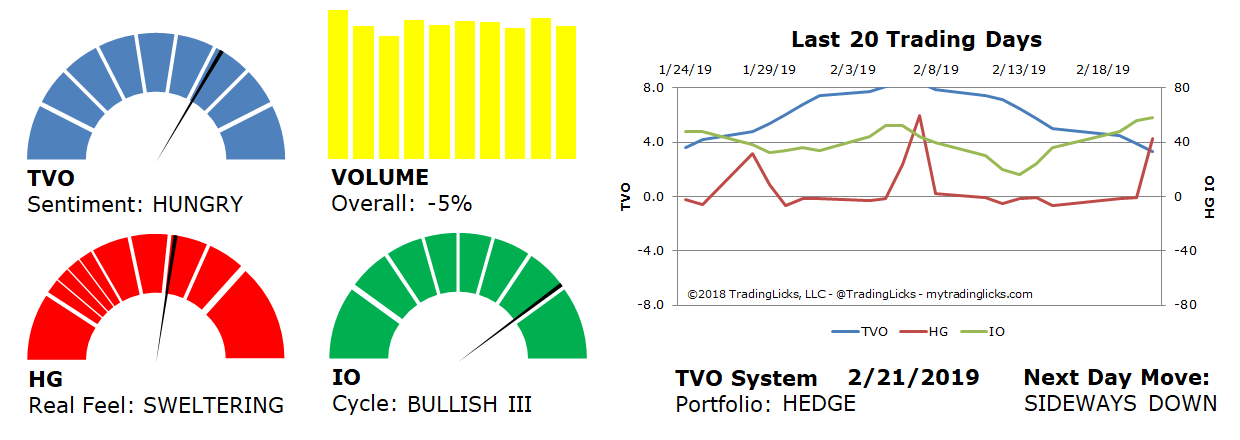
Sentiment: HUNGRY – Markets are accumulating at an accelerated rate and big institutional buying is heavy and aggressive.
Volume: -5% – Today’s volume was lower than the previous session.
Real Feel: SWELTERING – Bears were in control of the session with a slight trace of buying under the surface.
Cycle: BULLISH III – Retail investors have bitten off way more than they can chew.
Portfolio: HEDGE – The market is over saturated and long-term investments warrant some protection.
Next Day Move: SIDEWAYS DOWN -Â The probability that SPY will close positive in the next session is 52%.
Want to read more? Join our list. It's free.
For the full rundown on today's active signals and options trades, please log in. Not a Member? Join us today.
To view past positions check out our Trade History.
To find out what the indicators mean, visit our Market Volume Volume Barometer.
To learn more about market volume and how we trade, find us on Twitter (@TradingLicks) and StockTwits!
The indicator descriptions in the above graphic represent general market sentiment. The actual TVO System signals and trades are listed below in the Members Area. To view, please Login. Not a Member? Join us.