Day Trading Options Made Easy With Next Day Move

We all know the stories of the legendary traders who manage to beat the market. Their extreme methods often get them a lot of attention. Many years ago, though, in a somewhat modest trading firm on Wall Street, there was one trader who kept a low profile and was just as good as any of them.
In fact, the other traders at the firm weren’t even sure he existed, because he was rarely ever seen. His bottom line was the best out of all of them and the guy hardly ever showed up for work. Except, that is, around 15-20 minutes before the market close he would suddenly arrive at the office.
After glancing at the quote monitor (personal computers were virtually non-existent in those days), he’d pull a small notebook out of his pocket and write some numbers down. Then he would pick up the phone (cell phones were not around either) and make a call down to the trading floor and place an order.
Then he would disappear as fast as he came (sometimes he wouldn’t even take off his coat), and wouldn’t be seen again until around the same time the following day. Again the same routine… he looked at the screen (no charts, just numbers), crunched some figures then made the call, presumably to open a new trade or close out his position from the day before.
How was this legendary trader able to beat the market with only a small end of day window of opportunity? Was he an ex-floor trader whose tape reading skills developed to the point where an entire day’s worth of data could be instinctively summed up in minutes? If so, why hasn’t the current generation of day traders stumbled upon the same “trading by the gut” instinct and also freed themselves from watching screens all day?
A more likely explanation is that he stumbled upon some type of formula or indicator that not only worked consistently, but also could be calculated very quickly in the last few minutes of the day. And for that to be the case, the signals produced would have to be clear and easy to follow. Imagine if such an indicator was readily available, allowing traders to take most of the day off while still filling their quotas and then some.
Well, you don’t have to imagine it because we’ve got one of those and it’s called the Heat Gauge.
The Heat Gauge (HG) displays just how bullish or bearish the market is in real-time. It does this through an original formula that measures advance/decline volume data from a number of sources and produces a single numerical value that tells us almost everything we need to know. Just like our Wall Street legend, HG can sum up in the last few minutes of the day exactly what the “Next Day Move” in the market will be with consistent accuracy.
How well does it work?
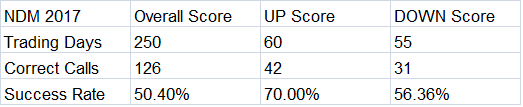
In 2017 Next Day Move accurately predicted UP moves on the S&P 500, 70% of the time. Overall score was just above 50% and DOWN moves were around 56%. But wait, isn’t 50% not much better than a coin toss? Well, anyone who’s been trading long enough knows that even 50% correct is not easy to come by, and many long time pros will do whatever it takes to even get close to obtaining those kind of odds.
And for the “win rate is not everything” crowd, our historical payoff ratio with call options exceeds 1 to 1 which means the wins are consistently larger than the losses. Even high probability trading systems go through performance lags now and then, but having a strong payoff ratio will help to keep your returns firmly on the plus side.
Next Day Move (NDM) was added to The TVO System in 2017.
The strategy involves trading SPY calls, one round trip trade a week, with less than 5% of your capital. Since it was added, the strategy on it’s own continues to maintain a 60% success rate (To see how NDM has performed with the TVO System since 2017, check out our Trade History).
The story of how Next Day Move came about goes back to 2016.
HG was already a highly effective indicator with a simple premise: when things are hot (or when HG numbers are high), get in the market. HG triggers buy signals when the values run high or “hot”, and it’s proven to be very successful in capturing short-term swing moves.
The HG system on its own has almost an 80% win rate, but the signals are infrequent. After observing HG for a while, though, I started to notice that the market would occasionally still go up even when it wasn’t so hot. It would also sometimes go down when it was cool and varying degrees in between.
At first the fluctuations seemed to be random, but it did look like specific numbers on the gauge coincided with certain next day moves. Was there was some way to quantify all the different temperature levels, so that depending on the reading you would know (with a certain level of probability) exactly where the market was going most of the time?
Well it turned out the answer was yes, NDM can predict the future of the S&P 500.
Using only end of day volume data, I found there was indeed a correlation between HG numbers and the subsequent moves. In April of 2016, “Next Day Move” was then included in TVO Market Barometer, posted every day before the market opens, giving readers the scoop if the next day S&P 500 is going UP, DOWN, SIDEWAYS, etc.
And that’s when others traders started to notice the value of its accuracy.
Knowing the Next Day Move can help you manage your open positions and give you a general feel of market conditions. There were, however, some challenges of turning it into a standalone trading system. For one thing, HG numbers were only finalized after 8pm and knowing NDM doesn’t really help as much when the market is already closed.
Ideally, if you know before the close what is going to happen tomorrow, there’s much more of an advantage in getting the trade in today, because you never know how the overnight futures will affect the open in the morning. And if the trade is already in, the harrowing experience of chasing opening gaps, up or down, can be gladly avoided.
To make the NDM strategy work, everything had to be in real-time, so through the power of streaming volume data, HG became live and in real-time up to the minute during market hours. The tools were now in place, but the hypothesis had let to be proven. It’s never a good idea to commit real capital unless you know the thing really works. And so began the long painstaking process of backtesting the NDM trading system in Excel.
Well, at the start, the preliminary results of the backtests were not too exciting. I tested an array of static temperature readings over a 10-15 year period based on the present outcomes I was seeing. And that was exactly the problem. A reading on HG in today’s market environment did not necessarily result in the same move that it did in the past.
The solution was that the system needed to be dynamic. Depending on the outcome of a move, the rules would have to be changed over time. Thousands of lines of code were needed to achieve this and my Excel spreadsheets were pushed to the limit (a more powerful PC was necessary just to run the program), but the past results finally started to match up with the present observations.
NDM uses a dynamic algorithm that automatically adjusts the signal of the move based on historical HG levels. As time goes on, the move forecasts will change along with how volume affects the market.
A lot of traders will adjust their indicators periodically (or abandon them entirely) based on market conditions. Next Day Move continually does this on its own to maintain accuracy. Through bull and bear markets, NDM will adapt just like a seasoned pro.
Did our legendary Wall Street pro trader have such a system? We may never know for sure, but for all traders alike, there are 2 lessons here we can benefit from:
1. Dust can build a mountain – In Japanese the expression is chiri mo tsumoreba, yama to naru (Even dust, when piled up, will become a mountain). Showing up to trade for just 15-20 minutes a day may not seem like a lot, but it’s those small well-thought out actions that will amount to greater successes down the line.
Many smaller gains from one trade per week will eventually add up. What also accumulates is the free time you’ll have left over to enjoy life. Think of it like day trading, but without giving up the day to do it.
2. There are 2 kinds of people who fail in the market… those who know too much and those who know too little – Staying away from the office and his fellow traders turned out to be a huge advantage. In today’s world, avoiding information overload is even more of a challenge. It’s important to stay focused on what actually works and realize that most of the other stuff, whether right or wrong, has no direct bearing on your trading method.
And when it comes to your method, you want to make sure you’ve done your research and arrived at your own sound conclusions. Even then, you have to be careful not to be easily influenced by others to over think your ideas. Otherwise, you’ll end up looping right back around to knowing too much.
The key to interrupting that loop and a leading a successful life, is finding just the right balance. Once you can do that, the sky is the limit. -MD
The Heat Gauge and Next Day Move are fully accessible for free in real-time at Volume Now.
To experience what HG and NDM can do for you and your trading, become a member today.
Want to read more? Join our list. It's free.
For the full rundown on today's active signals and options trades, please log in. Not a Member? Join us today.
To view past positions check out our Trade History.
To find out what the indicators mean, visit our Market Volume Volume Barometer.
To learn more about market volume and how we trade, find us on Twitter (@TradingLicks) and StockTwits!