What happens if the Nasdaq can’t keep up?

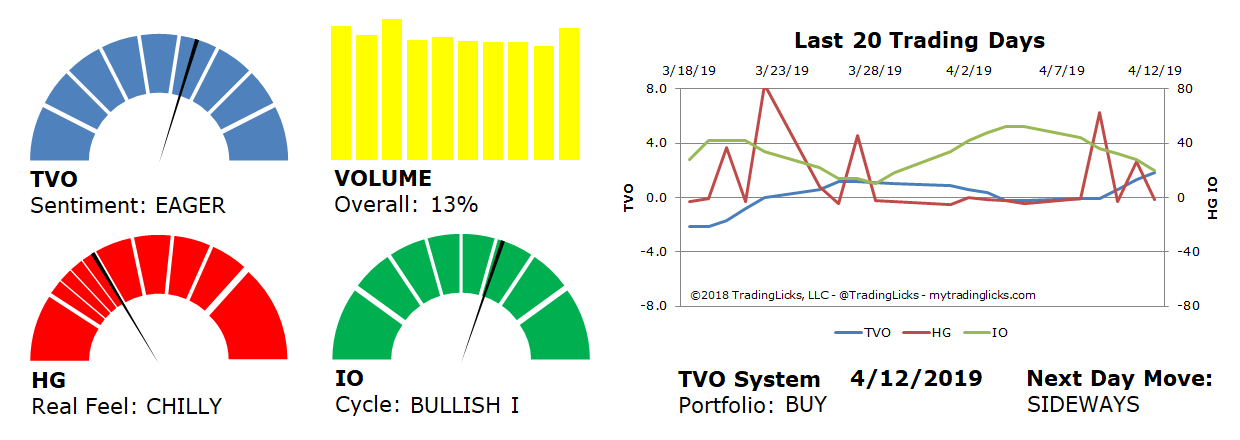
Last Friday markets gapped up at the open, pushing the S&P 500 over the “psychologically important” 2900 mark and a stone’s throw away from making the weekly head and shoulders pattern a distant memory. Overall volume swelled 13% as the bulls continue to cheer the rise that seems to defy all fundamental rhyme or reason.
Which is all mostly justified except that the Nasdaq is not really on the same page.
So far this month, with the exception of 4/3, while most of the other indices were accumulating, the Nasdaq just barely held its own in terms of volume (with even a bit of distribution last week).
What’s the big deal if the Nasdaq can’t keep up with the rest?
It’s known mostly as a “tech heavy” index, but the fact is most of the Wall Street darlings are listed there. Without the Nasdaq leading the way, it’s only a matter of time before the rest of the pack starts struggling for direction.
Upcoming earnings can certainly turn things around, but until then the bulls may want to wait for the leader to start leading before blindly chasing all-time highs. -MD

Sentiment: EAGER – Markets are in accumulation mode and big institutions are buying at a slow and steady pace.
Volume: 13% – Today’s volume was higher than the previous session.
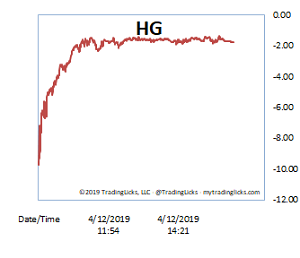
Real Feel: CHILLY – Bulls were in control of the session with substantial selling under the surface.
Cycle: BULLISH I – Retail investors are confident and slightly overweight in their holdings.
Portfolio: BUY – The market is healthy and it’s a good time to contribute to long-term investments.
Next Day Move: SIDEWAYS -Â The probability that SPY will close positive in the next session is 53%.
Want to read more? Join our list. It's free.
For the full rundown on today's active signals and options trades, please log in. Not a Member? Join us today.
To view past positions check out our Trade History.
To find out what the indicators mean, visit our Market Volume Volume Barometer.
To learn more about market volume and how we trade, find us on Twitter (@TradingLicks) and StockTwits!
The indicator descriptions in the above graphic represent general market sentiment. The actual TVO System signals and trades are listed below in the Members Area. To view, please Login. Not a Member? Join us.
