What Happened To All-Time Highs?

After 2 across-the-board accumulation days last week, just when all-time highs were in reach, bears took control last Friday (and today) and quickly dashed all hopes for a continued rally.
What happened?
Well, you can hold the Fed comments responsible, but from a technical standpoint, any kind of retest would be in order after the massive V recovery we had since the May correction (Yes folks, a correction, not a bear market, is technically what it’s called). What’s taking the bulls by surprise, though, is that it’s looking like their “safe” breakaway gap above the SPY high tight flag is now in danger of getting filled.
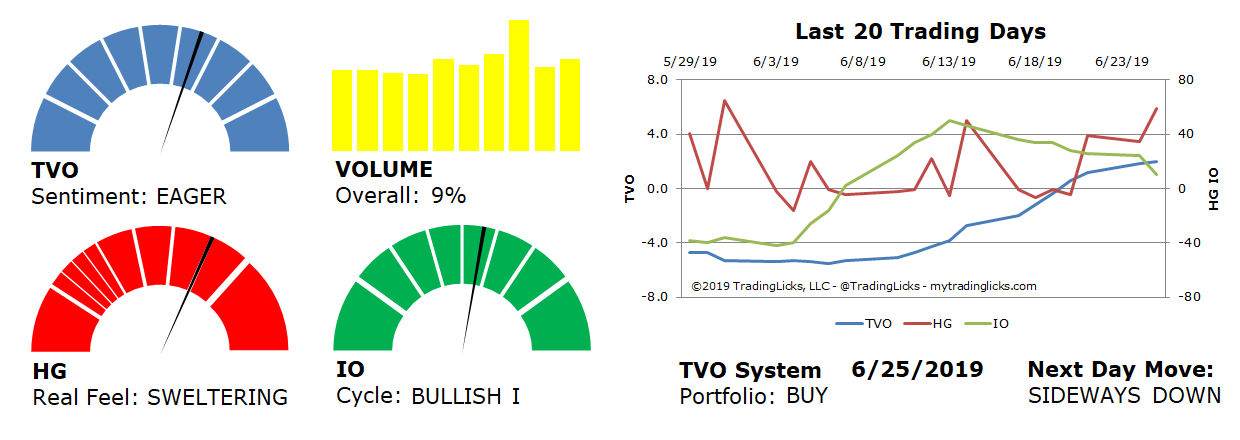
Today’s overall volume rose almost 10%… which is not too difficult a feat, however, considering that Monday’s volume fell -35%… which wasn’t all that notable as it was just in reaction to the +36% op-ex volume rise on Friday (which is what you normally get with op-ex). Anyway, I’m not taking any credit from the bears here as they are doing quite a job, but the overall volume trend (with TVO still rising) is still in an accumulation phase and thus we are in BUY mode.
If they can knock TVO back down below zero, it will get my attention. In the meantime, as far as the big institutions are concerned, buying dips (after filling gaps of course) is still the first order of business. -MD

Sentiment: EAGER – Markets are in accumulation mode and big institutions are buying at a slow and steady pace.
Volume: 9% – Today’s volume was higher than the previous session.
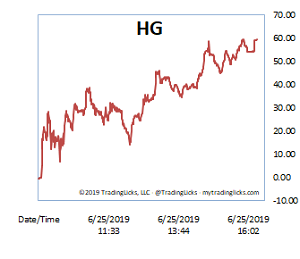
Real Feel: SWELTERING – Bears were in control of the session with a slight trace of buying under the surface.
Cycle: BULLISH I – Retail investors are confident and slightly overweight in their holdings.
Portfolio: BUY – The market is healthy and it’s a good time to contribute to long term investments.
Next Day Move: SIDEWAYS DOWN – The probability that SPY will close positive in the next session is 52%.
Want to read more? Join our list. It's free.
For the full rundown on today's active signals and options trades, please log in. Not a Member? Join us today.
To view past positions check out our Trade History.
To find out what the indicators mean, visit our Market Volume Volume Barometer.
To learn more about market volume and how we trade, find us on Twitter (@TradingLicks) and StockTwits!
The indicator descriptions in the above graphic represent general market sentiment. The actual TVO System signals and trades are listed below in the Members Area. To view, please Login. Not a Member? Join us.
