What can be more reliable than the yield curve? – TVO MB 3-22

On Friday, markets made a swift about-face and erased all of Thursday’s gains and then some. In the news, they’re saying it’s all about the yield curve which suddenly inverted, indicating a recession is on the horizon. Since the guy who first researched the yield curve inversion back in 1986, the signal has occurred 3 times and in all those cases a recession did follow.
Well, I don’t know about you, but if I discovered a system that only triggered 3 times in the last 30 years, the chances of that system seeing the light of day on this website are slim and none. In other words, the sample size is way too small for any degree of confidence in the results.
Anyway, moving on from statistics…
There are folks out there that are saying that Thursday’s rise was clearly a “head fake” caused by divergences across the indices. Am I saying that we sold all of our SPY calls for a +31% gain on Thursday for exactly that reason? No, not a chance. In fact, Thursday was clearly a volume accumulation day for the Nasdaq among many others in the month of March (Not much faking going on if you ask me).
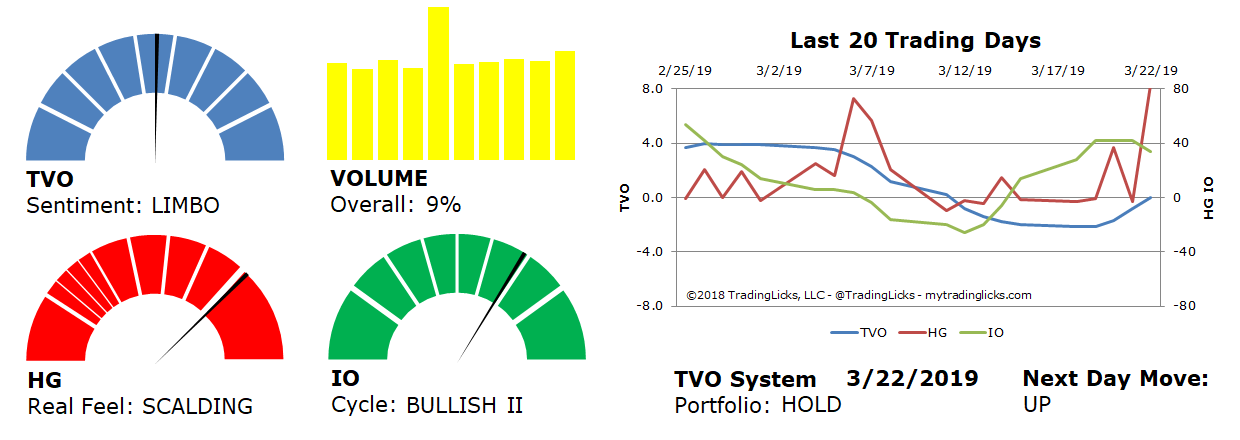
And TVO, our volume oscillator, reversed towards positive values this past week (TVO is an indicator with over 20 years of both in and out of sample data, covering a sample size of almost 100 signals), which is much more telling of what is happening right now (if you ask me).
So if it wasn’t a head fake, how did we know to sell? That’s an easy one, although not always so easy to do. The answer is we sell into strength.
All of our strategies have time-tested sell rules built right in so we don’t have to waste any time second guessing head fakes and yield curve jargon. Why the market sold off is anybody’s guess, but you can bet that after a run-up, a shake-out will soon follow. Impending recession or not, selling into strength will always keep you ahead of the game. -MD

Sentiment: LIMBO – Markets are neutral and sentiment can go either way from here.
Volume: 9% – Today’s volume was higher than the previous session.
Real Feel: SCALDING – Bears dominated the session and buying was practically non-existent.
Cycle: BULLISH II – Retail investors are overly cocky and heavily positioned in their holdings.
Portfolio: HOLD – The market is in a period of indecisiveness and the best place is on the sidelines.
Next Day Move: UP -Â The probability that SPY will close positive in the next session is 56%.
Want to read more? Join our list. It's free.
For the full rundown on today's active signals and options trades, please log in. Not a Member? Join us today.
To view past positions check out our Trade History.
To find out what the indicators mean, visit our Market Volume Volume Barometer.
To learn more about market volume and how we trade, find us on Twitter (@TradingLicks) and StockTwits!
The indicator descriptions in the above graphic represent general market sentiment. The actual TVO System signals and trades are listed below in the Members Area. To view, please Login. Not a Member? Join us.
