TVO Market Barometer: So long, farewell, my 200 Day MA

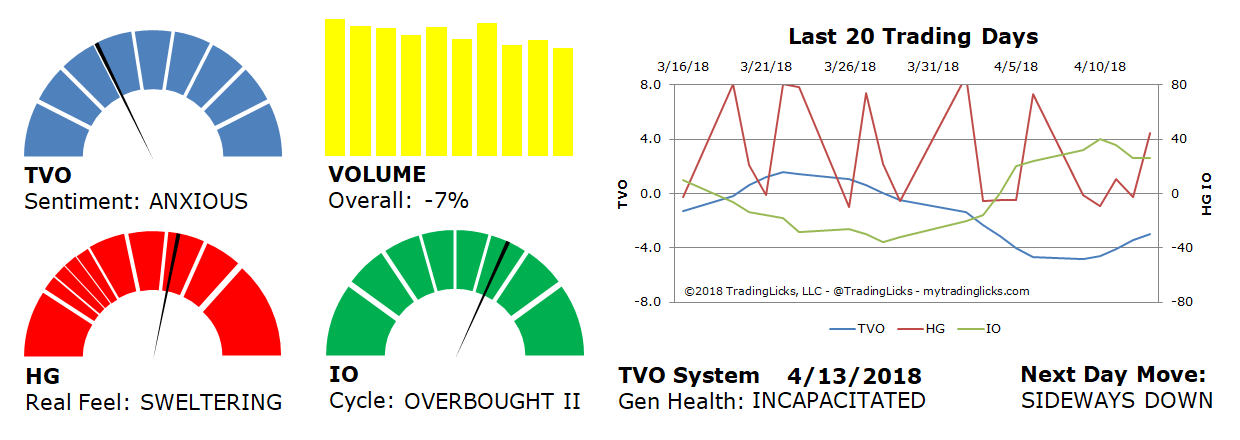
The dreaded Friday the 13th came and went rather quietly. What many bears thought would be the day of the deadly blow that would sink the markets, turned out to be the end of the first distribution-free week we’ve had since the beginning of March. Declining volume did leave us SWELTERING, but overall volume fell and so did volatility.
TVO, our long-term volume oscillator, has been steadily rising back towards positive values, so institutional selling has been tapering off for a couple of weeks now. Our shorter term Issues Oscillator (IO) is in overbought territory, so we may see some sideways and back filling action over the next few sessions… At this point, though, the S&P 500 will more likely move on to a new dance partner (the 50 Day MA), than rekindle its short but tumultuous affair with the dreaded 200 Day MA. -MD
Want to read more? Join our list. It's free.
For the full rundown on today's active signals and options trades, please log in. Not a Member? Join us today.
To view past positions check out our Trade History.
To find out what the indicators mean, visit our Market Volume Volume Barometer.
To learn more about market volume and how we trade, find us on Twitter (@TradingLicks) and StockTwits!
The indicator descriptions in the above graphic represent general market sentiment. The actual TVO System signals and trades are listed below in the Members Area. To view, please Login. Not a Member? Join us.
