TVO Market Barometer 7-30: Do we sell or buy this dip?
Last week it was GDP that failed to make an impression on the stock market. After Monday’s continued rout, however, where some major tech names like Netflix and Twitter dropped -5% or more, at the end of the day it was volume that was not very impressed.
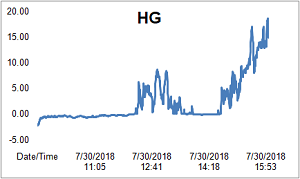
Overall volume fell back -3%, but despite the sell-off, our Heat Gauge was COOL for most of the day and was barely able to get much hotter than BALMY. In fact, most of the declining volume came in the latter part of the session, just when it appeared that the dip was being bought.
But wait… So does that mean folks are actually selling the dip, then? Well, yes they are… The retail investors that is. The real smart money buyers have yet get on board. Whether they’re waiting for the 50 day MA remains to be seen.
And rest assured the 50 day will be seen, it’s just a question of when.
So you may be asking “Should I sell or buy this dip?” Well, if you know your time frame, have a solid exit plan and have a method of tightly controlling risk, then it’s a question you don’t need to ask. -MD
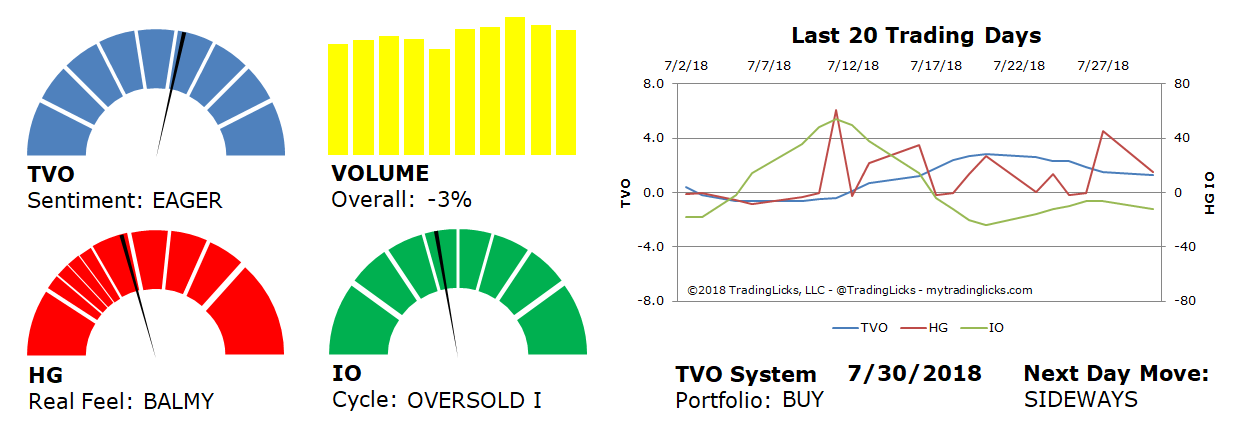
Sentiment: EAGER – Markets are in accumulation mode and big institutions are buying at a slow and steady pace.
Volume: -3% – Today’s volume was lower than the previous session.
Real Feel: BALMY – Bears were in control of the session with considerable buying under the surface.
Cycle: OVERSOLD I – Retail investors are uncertain and very light in their holdings.
Portfolio: BUY – The market is healthy and it’s a good time to contribute to long-term investments.
Next Day Move: SIDEWAYS -Â The probability that SPY will close positive in the next session is 55%.
Want to read more? Join our list. It's free.
For the full rundown on today's active signals and options trades, please log in. Not a Member? Join us today.
To view past positions check out our Trade History.
To find out what the indicators mean, visit our Market Volume Volume Barometer.
To learn more about market volume and how we trade, find us on Twitter (@TradingLicks) and StockTwits!
The indicator descriptions in the above graphic represent general market sentiment. The actual TVO System signals and trades are listed below in the Members Area. To view, please Login. Not a Member? Join us.