TVO Market Barometer 7-18: Gartman is right… just a little late.
Since last week’s break of the June highs, the market has been edging higher. And contrary to what most chart folks are seeing, so has overall volume.
As the wave of heavy accumulation that came in just after the 4th of July holiday continues to build momentum, the so-called “experts” (like Dennis Gartman and his uncanny knack for getting it wrong) are just now starting to tell us to hold on for the big rally. But when you take a step back, the rally we’re seeing now really got underway back in April, carving higher highs and higher lows ever since.
So this time, they just may have gotten it right. It would be nice, though, if their predictions came in before the actual the results, but better late than never.
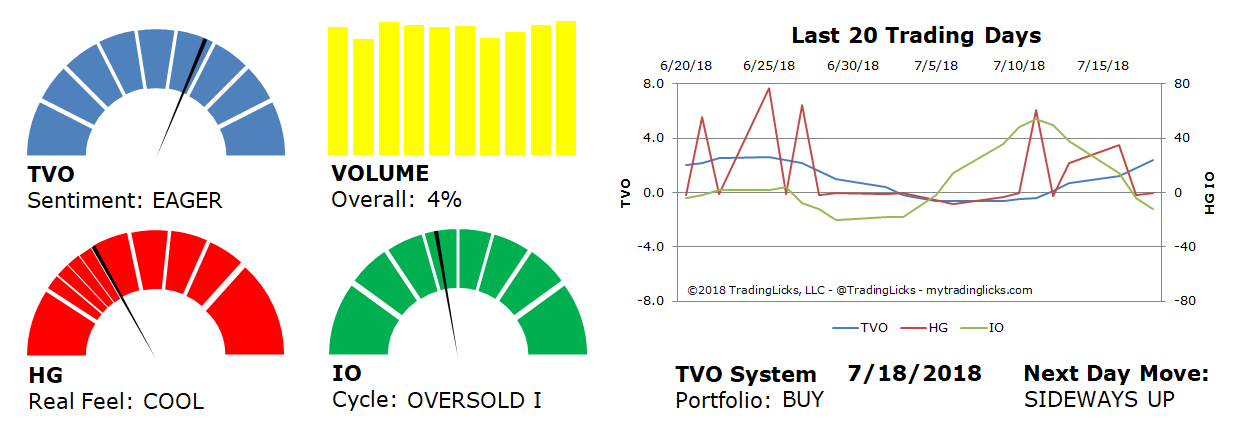
TVO, our volume oscillator, is now pushing the upper end of the healthy market range and may soon shift our long-term portfolio into HEDGE mode. IO, our issues oscillator, on the other hand is saying markets are OVERSOLD and still have room to run in the short-term. -MD
Sentiment: EAGER – Markets are in accumulation mode and big institutions are buying at a slow and steady pace.
Volume: 4% – Today’s volume was higher than the previous session.
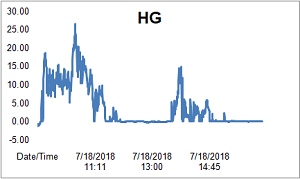
Real Feel: COOL – Bulls and bears were at a stalemate for the session.
Cycle: OVERSOLD I – Retail investors are uncertain and very light in their holdings.
Portfolio: BUY – The market is healthy and it’s a good time to contribute to long-term investments.
Next Day Move: SIDEWAYS UP -Â The probability that SPY will close positive in the next session is 55%.
Want to read more? Join our list. It's free.
For the full rundown on today's active signals and options trades, please log in. Not a Member? Join us today.
To view past positions check out our Trade History.
To find out what the indicators mean, visit our Market Volume Volume Barometer.
To learn more about market volume and how we trade, find us on Twitter (@TradingLicks) and StockTwits!
The indicator descriptions in the above graphic represent general market sentiment. The actual TVO System signals and trades are listed below in the Members Area. To view, please Login. Not a Member? Join us.