Options Position Sizing For Low Risk And High Growth

Congrats! You’ve just graduated from the school of options. You know everything there is to know about calls, puts, spreads, strangles, condors, etc., and you’re ready to make your first trade. The order ticket is filled out and you’re good to go except for one question… How many contracts should I trade?
There are countless methods out there about how to position size when it comes to stocks (with several large books dedicated exclusively to the subject), but hardly any have a definitive method for applying position sizing to options.
That is, until now.
The Options Positions Sizer (which is now available for your mobile device) takes all the guesswork out of what can often be a daunting task… Trading options with just the right amount of contracts.
There are some folks that may say, well it’s really easy… you just simply take a certain percentage of your account for each position. Problem solved!
But anyone out there with a halfway decent options school degree knows how things like the strike price and expiration date can drastically affect the options premium. And depending on these factors when you enter the trade, a percentage position can go a very little or not such a very long way.
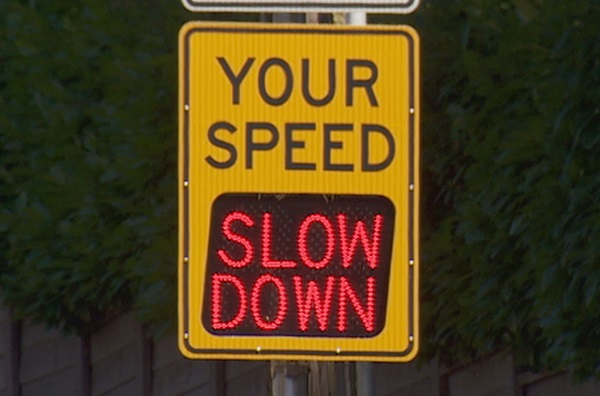
Think of options trading like driving a car, and the amount of contracts is how fast you can drive. You may be able to get up to a considerable speed, but given the risk inherent in options (where a 100% loss is possible), it’s a good idea to know how to use the brake. And driving too slow also has its dangers as well.
So what speed is just right? Some symbols may vary, but for SPY options it’s somewhere between 5 and 10% of total account capital for each position. Let’s go through a potential trade with our own TVO System and the Options Positions Sizer to see how it works.

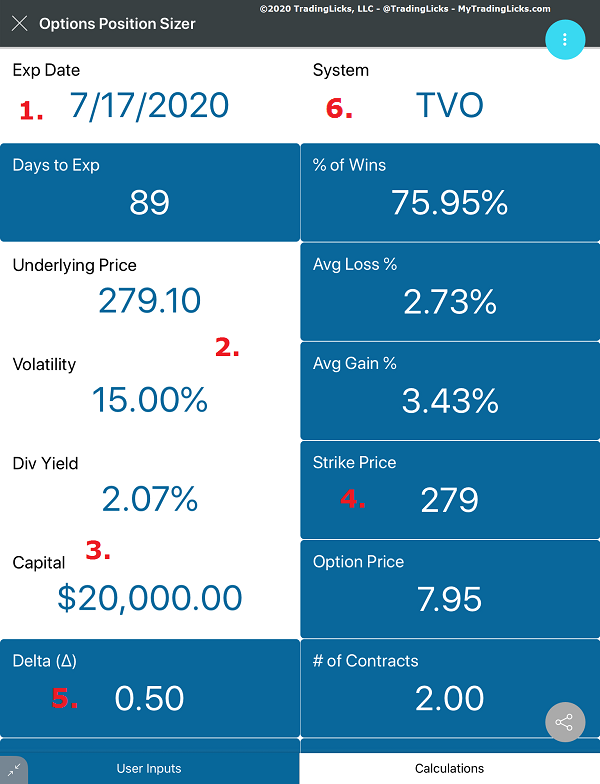
1. If position size is the speed limit, then Theta or days left to expiration (DTE) is the amount of gas in the tank. You want to make sure you’re not left holding calls while Theta starts to burn (if you’re selling calls that’s another story).
The premium starts to rapidly decay about 30 days before the expiration date, so determine the maximum length you need for your trading strategy to play out, and then add 30 days on top of that. So for example if you need a month for the trade, choose an expiration date that’s at least 60 days from now.
2. Next up is the underlying price of SPY, Implied Volatility (IV) and Dividend Yield. When you open the calculator, these fields will be filled in with the previous day’s data. This can eventually be changed on the fly closer to the trade, but having this data automatically updated gives us a head start.
Underlying price, IV, DTE along with dividend yield and the interest rate are used to calculate the options price. This is done automatically with a Black-Scholes calculator, which is conveniently built right in.
3. The total capital is the value of all open positions plus cash in your account.
4. The strike price is the underlying price rounded to the nearest dollar. This gives us close to a .50 Delta, which is considered to be at the money (ATM).
In a typical options chain there are literally hundreds of strikes to choose from. Let’s find out why ATM is the way to go…
5. If Theta is the gas in the tank then Delta is the oil gauge. Being low on oil wears down the engine and low Delta has a similar effect on both your premium and the chances of a profitable trade. Too much oil is, well, just unnecessary, and a higher delta adds considerably to the premium and weighs down price action, making the option behave more like a stock.
For some this seems like a path to less risk, but as Delta gets closer to 1, your calls get deeper in the money (ITM) – the strike is less than the underlying price – and much more expensive. When your risk is defined by premium paid, expensive options can quickly get you in over your head.
So ITM calls cost more and take up more of your capital, but what about cheaper out of the money (OTM) calls? Well, as they say, when things are cheap, you get what you pay for. When you don’t have enough quality oil, your engine suffers and so does your trading capital.
Lower Delta or OTM calls – the strike is more than the underlying price – , are certainly alluring in that they increase leverage significantly. But with higher leverage comes a much quicker Theta burn off. Compared with at the money (ATM) calls, which start to lose their value in their last 30 days, OTM calls start their time decay much sooner.
OTM calls work out great if your trade goes well in a short time frame, like a day or two. But if you need more time for things to play out, the benefit of leverage will slowly fade, and even if the underlying stock goes up, you still may end up losing money.
6. What kind of car are you driving? Here’s where you’ll find the statistics of your system. The stats for all the TVO System strategies are available from the dropdown menu.
Now let’s see what’s going on under the hood and how the system stats apply to the end result…

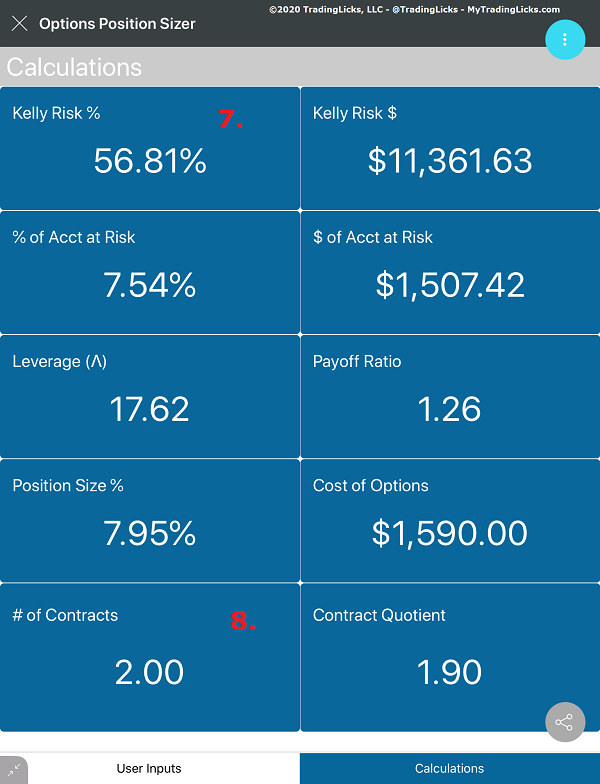
7. The Kelly Criterion, or fortune’s formula, was developed as a way to determine just the right amount of cash to bet.
The theory is that the formula will allow you to build your bankroll steadily based on the parameters of your own system’s past performance. The only problem, however, is that when applied to trading, the “bet size” is often way too large for any sensible amount of risk, especially when trading several positions at once.
As a result, the Kelly percentage is often modified (Larry Williams was famous for his “Half-Kelly” method). In this example the recommend 56.81% (more than half of account capital!) has been reduced to a more manageable 7.54%.
8. The Contract Quotient is the decimal result of the amount at risk divided by the options price. This number is then rounded to the nearest whole number giving us a total of 2 contracts. You can’t trade 1.90 options contracts, but it helps to see if you’re close to the next lower or higher number, especially as you get closer to the speed limit.
So what exactly is the speed limit? This can vary depending on how many positions or systems you use, but generally with SPY options you may want to limit your position size to no more than 10% of total account capital. When you’re driving, there are times when you exceed the speed limit (except in certain states, but that’s another story), but in trading you should always keep it under.
How do you know what the limit is in your trading? Well, first try to imagine the largest drawdown you would be able to handle. If you backtest your system you can easily find out historically what the largest drawdown was. That percentage is the highest amount of your account that you would trade at any one time, meaning all your open positions would not exceed that number.
In backtesting (and actual trading) our TVO System was able to recover from drawdowns as large as 20%, so we’re constantly eyeing that number as a maximum risk level.
We’re using 4 different systems and since there are sometimes 2 or 3 open at the same time, keeping each position under 10% allows for more flexibility while maintaining our determined level of risk. Following the speed limit gives us the confidence that if things go south, we know our system has the ability to make a complete recovery.
The effect of leverage with options can indeed exponentially increase your return on investment (ROI), but it is the risk of ruin (ROR) that you really need to watch out for. Also, keep in mind that it takes a 100 percent gain to recover from a 50 percent drawdown. Having an optimal position size is just as important as any edge you’ve come to develop in your trading.
Along with being a great driver/trader, proper position sizing is what keeps the car on the road and running for many more trips to come. —MD
Sign up for a 30 day free trial membership and download the Options Position Sizer today!
Want to read more? Join our list. It's free.
For the full rundown on today's active signals and options trades, please log in. Not a Member? Join us today.
To view past positions check out our Trade History.
To find out what the indicators mean, visit our Market Volume Volume Barometer.
To learn more about market volume and how we trade, find us on Twitter (@TradingLicks) and StockTwits!
The Options Position Sizer is an educational tool. It is not intended to provide investment advice, and users of the Options Position Sizer should use their own discretion when making investment decisions based upon values generated by it.
