Never doubt that a small group of stocks can take down the market.

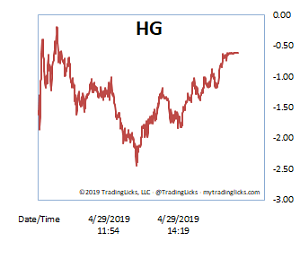
Shares of Google’s Alphabet stock rose on Monday in anticipation of earnings only to tumble in the after hours session. Looking at the smooth arc of the price going up like a rocket intraday, you would think that most folks were on the same bullish page. On our Heat Gauge, however, the values that plunged 2 points by midday had sharply snapped back by the close… in other words, the volume showed a distinctive reversal of sentiment, where prices didn’t.
You’re probably thinking, what does Google have to do with the volume of the rest of the market? The answer is nothing really, or the answer could be just about everything. When it comes right down to it, even though thousands of stocks are being traded, Wall Street is all about the story. And the story of Google, which is continually being rewritten, is about as big a story as you can get.
To elaborate on a famous quote by Margaret Mead: “Never doubt that a small group of stocks can take down the entire market; Indeed, it’s the only thing that ever has.” The market is constantly following the leaders looking for direction. We’ll see if Google is a big enough force to shift momentum, but the big boys behind the volume already seem to think so. -MD

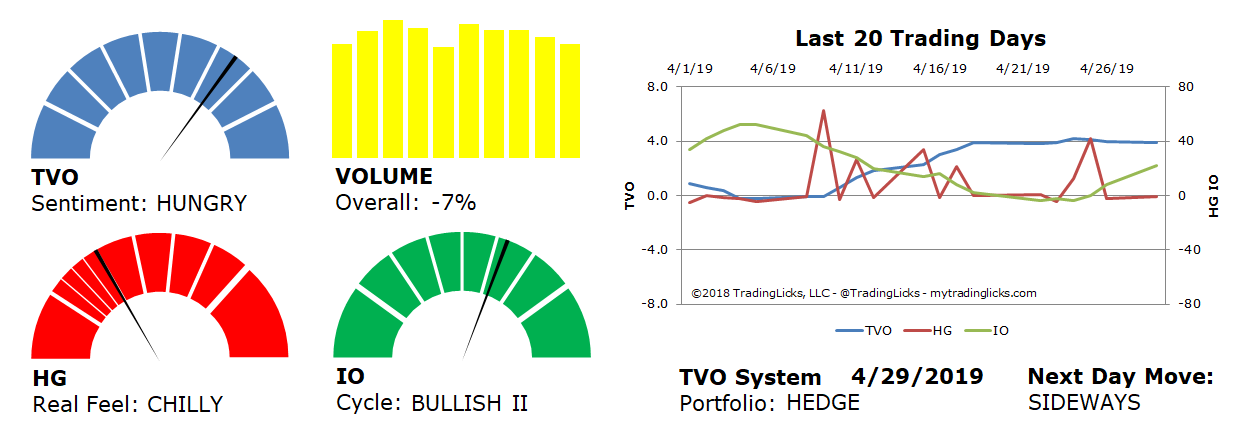
Sentiment: HUNGRY – Markets are accumulating at an accelerated rate and big institutional buying is heavy and aggressive.
Volume: -7% – Today’s volume was lower than the previous session.
Real Feel: CHILLY – Bulls were in control of the session with substantial selling under the surface.
Cycle: BULLISH II – Retail investors are overly cocky and heavily positioned in their holdings.
Portfolio: HEDGE – The market is over saturated and long-term investments warrant some protection.
Next Day Move: SIDEWAYS -Â The probability that SPY will close positive in the next session is 53%.
Want to read more? Join our list. It's free.
For the full rundown on today's active signals and options trades, please log in. Not a Member? Join us today.
To view past positions check out our Trade History.
To find out what the indicators mean, visit our Market Volume Volume Barometer.
To learn more about market volume and how we trade, find us on Twitter (@TradingLicks) and StockTwits!
The indicator descriptions in the above graphic represent general market sentiment. The actual TVO System signals and trades are listed below in the Members Area. To view, please Login. Not a Member? Join us.
