Just a bit of sector rotation or something more? – TVO MB 4-10

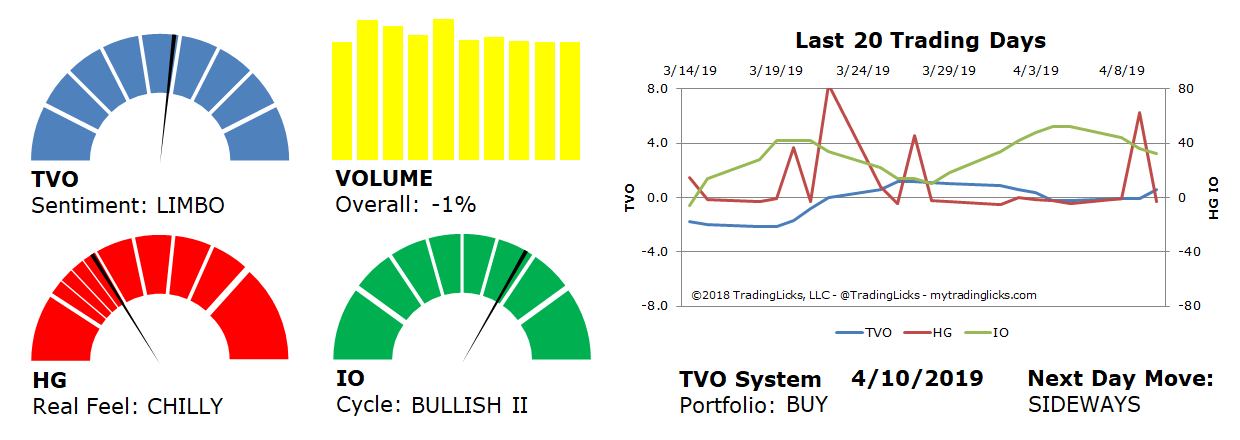
The Fed delivered no surprises on Wednesday and “reassured” investors that rates are not going up anytime soon. If you follow volume (or this blog), however, that reassurance has been noticeable on our Heat Gauge since the end of March, with every session (the exception being this past Tuesday) ending in the bullish CHILLY to FRIGID range.
Some of you may have also noticed that FRIGID now often leads to a Next Day Move of “SIDEWAYS,” where just a few weeks ago it came out as a bit more bearish “SIDEWAYS DOWN.” Well, in lieu of giving away our industry secret, lets just say that historical bullish moves just got a bit more bullish.
And who are we to argue with volume.
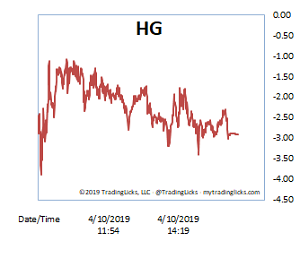
After Wednesday’s open, HG briefly warmed up, but then slowly got colder as the day progressed, leaving the SPY 283-284 breakaway gap well-guarded for the time being. Overall volume fell, but the Big Board did manage to squeeze out bit of accumulation, which is in contrast to Tuesday’s distribution on the Nasdaq.
When I think of divergences in a consolidating market, 3 things come to mind: Rotation, rotation, rotation (Well, that’s really only one thing). In any case, though, rotation once or twice can be healthy, but more than that is something to watch out for. -MD

Sentiment: LIMBO – Markets are neutral and sentiment can go either way from here.
Volume: -1% – Today’s volume was lower than the previous session.
Real Feel: CHILLY – Bulls were in control of the session with substantial selling under the surface.
Cycle: BULLISH II – Retail investors are overly cocky and heavily positioned in their holdings.
Portfolio: BUY – The market is healthy and it’s a good time to contribute to long-term investments.
Next Day Move: SIDEWAYS -Â The probability that SPY will close positive in the next session is 53%.
Want to read more? Join our list. It's free.
For the full rundown on today's active signals and options trades, please log in. Not a Member? Join us today.
To view past positions check out our Trade History.
To find out what the indicators mean, visit our Market Volume Volume Barometer.
To learn more about market volume and how we trade, find us on Twitter (@TradingLicks) and StockTwits!
The indicator descriptions in the above graphic represent general market sentiment. The actual TVO System signals and trades are listed below in the Members Area. To view, please Login. Not a Member? Join us.
