Is This Flag Flying High Or Just Fake News?

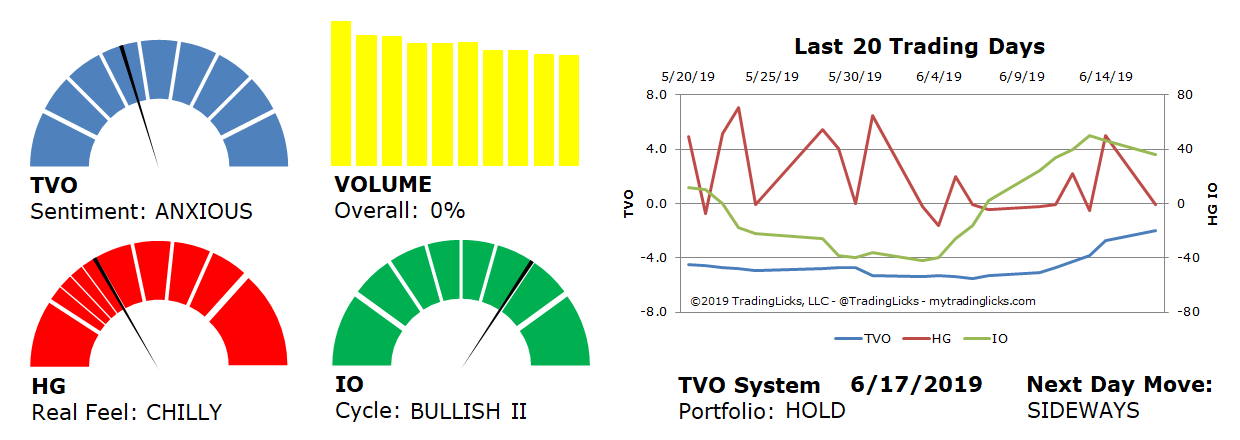
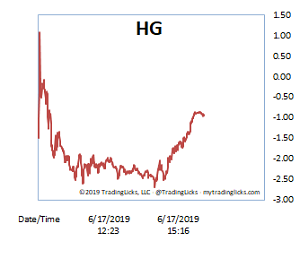
It’s already the 3rd week in June, summer is fast approaching, and we still have yet to see anything earth shattering as far as market volume since the May selloff. Monday’s overall volume barely budged, so even though our Heat Gauge was CHILLY most of the session, accumulation is apparently not part of the plan at the moment.
One look at the daily chart of the S&P 500, though, might reveal the reason why low volume may now be in the bulls favor. I’m not one for charts, but it’s hard not to notice the “high tight flag” forming on the S&P just above the 50 day moving average.
The occurrence of this pattern is quite rare, and even more so when it happens on an index. The expected resolution of the HTF is that way more upside is coming, but the simple fact that it’s a rare pattern means that statistics can’t realistically back up that claim.
If that’s the case then why do market longs get so excited every time they see the high tight flag?
Well, never underestimate the power of anecdotal evidence… you know, the incredible stories we’ve all heard about the “one that got away” or “my grandfather smoked 3 packs a day and lived to be 90.” Nowadays these accounts are commonly referred to as “fake news” and more often refer to the exception rather than the norm.
As a trader, if you’re lucky, you’ll trade a “rare pattern” and lose the first time out, walking away all the wiser with your account still intact. If you’re not so lucky, you’ll win big on the same rare pattern several times in a row and then decide to bet it all on the next one… the last one, which usually turns out to be the one big loss that triggers the margin call and the end of your account.
We’ll soon see where this flag is going, but in the meantime it’s always a good idea to keep a good measure on your position size and limit risk accordingly. -MD

Sentiment: ANXIOUS – Markets are in a distribution phase where big institutions are selling to reduce their exposure.
Volume: 0% – Today’s volume was higher than the previous session.
Real Feel: CHILLY – Bulls were in control of the session with substantial selling under the surface.
Cycle: BULLISH II – Retail investors are overly cocky and heavily positioned in their holdings.
Portfolio: HOLD – The market is in a period of indecisiveness and the best place is on the sidelines.
Next Day Move: SIDEWAYS -Â The probability that SPY will close positive in the next session is 53%.
Want to read more? Join our list. It's free.
For the full rundown on today's active signals and options trades, please log in. Not a Member? Join us today.
To view past positions check out our Trade History.
To find out what the indicators mean, visit our Market Volume Volume Barometer.
To learn more about market volume and how we trade, find us on Twitter (@TradingLicks) and StockTwits!
The indicator descriptions in the above graphic represent general market sentiment. The actual TVO System signals and trades are listed below in the Members Area. To view, please Login. Not a Member? Join us.
