Is The Selling Winding Down Or Just Getting Started?

Monday was a pretty volatile session, as the bears (who claim are “just getting started”) managed to knock the major indices further under the 200 day line.
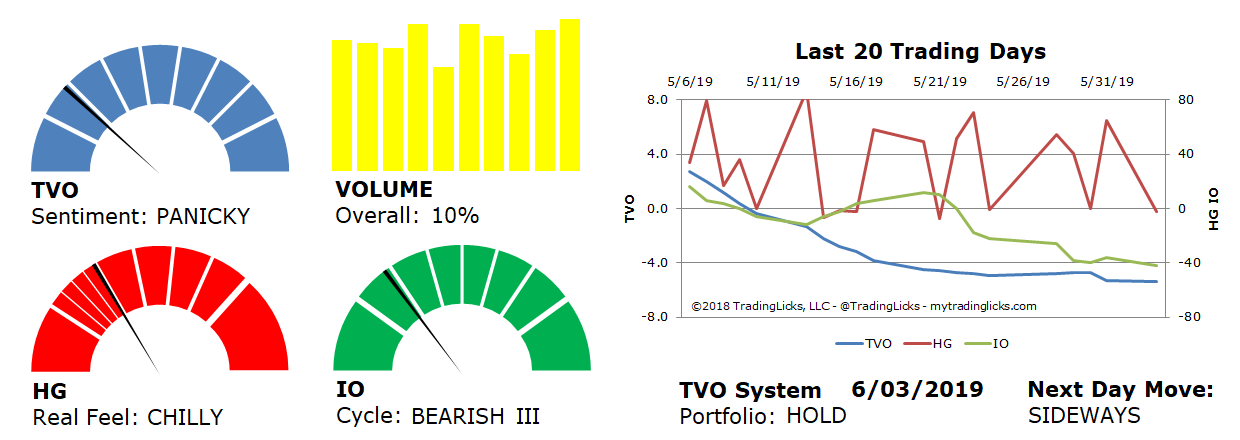
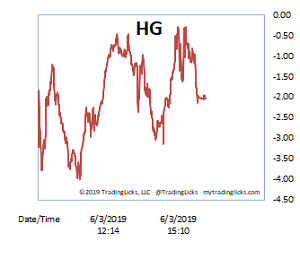
The Nasdaq was hit especially hard as overall volume rose 10%, but surprisingly there was not enough declining volume to put any of the indices in the distribution category. In fact, as far as internals go, with our Heat Gauge in the CHILLY range, the day went firmly for the bulls. There was even a bit of accumulation (which hasn’t shown it’s head for at least 2 weeks) on the S&P 500… despite the fact that the index finished down price-wise.
If big institutions are buying stocks and a reversal is in the works, then why do average investors feel like they’re the last to know? Well, because in reality they usually are the last to know.
And you can spot them quite easily. Parades of them often suddenly start piling in to the short the lows. They refuse to cover (because the “fun has just begun”), even after what has been a spectacular -7% drop off the highs. They’re also the same late-to-the-party folks that piled in at those highs back in April.
We’ll soon see if indeed more downside is in the cards, but at the moment there are a whole lot more folks banking on the “short squeeze” (to which the late comer crowd deserves full credit) at this stage of the game. -MD

Sentiment: PANICKY – Big institutions are having an all out liquidation sale.
Volume: 10% – Today’s volume was higher than the previous session.
Real Feel: CHILLY – Bulls were in control of the session with substantial selling under the surface.
Cycle: BEARISH III – Retail investors are running for the hills.
Portfolio: HOLD – The market is in a period of indecisiveness and the best place is on the sidelines.
Next Day Move: SIDEWAYS – The probability that SPY will close positive in the next session is 53%.
Want to read more? Join our list. It's free.
For the full rundown on today's active signals and options trades, please log in. Not a Member? Join us today.
To view past positions check out our Trade History.
To find out what the indicators mean, visit our Market Volume Volume Barometer.
To learn more about market volume and how we trade, find us on Twitter (@TradingLicks) and StockTwits!
The indicator descriptions in the above graphic represent general market sentiment. The actual TVO System signals and trades are listed below in the Members Area. To view, please Login. Not a Member? Join us.
