Bear market rally or just a glitch in the bull? – TVO MB 2-01
After receiving much feedback last year that TVO was a “bull market only” system, I took a blogging hiatus in January to test out some new strategies. While I was digging earnestly for new ways to trade, both long and short, I kept trading the system like I always have since 2014.
Here we are in February and our account is already up +15% for 2019. And the best part is we managed to do it with only 4 round trip trades. The lesson to be learned? Keep things simple, stick to your system and don’t listen to anybody’s bullshit.
Now you might be saying, it was a “rare” V bottom and catching it was just pure luck… but this has happened before. Those who say they’ve never seen a V bottom like this must have a short-term memory. It not only happened in ’09, but also in ’11, ’14, ’15 and ’16 (the 2014 one was particularly memorable), and TVO caught them every time. And whether you call the rise off of the December lows a bear market rally or just a “glitch” in the 9 year bull, TVO still nailed it either way.
In a system that works consistently 65% of the time over decades of trades, if you wait long enough things will turn around. Granted, waiting it out was tough in ’18, especially when a drawdown happens at the end of the year when things are supposed to be good. But that’s when your resolve as a trader is really put to the test because markets are, well, just not rational.
Our survival instinct as humans is to try to make sense of our surroundings. This works well in the wild to protect us from danger, but it does a terrible job in the stock market. And the reason is that there are an infinite number of factors involved, making it inhumanly possible to keep track of them all.
Oh, I bet you think you can with your multiple screens, real-time price charts and 24 hour news feeds, but we’re just not wired that way.
And then there’s the “everything is manipulated” crowd. It reminds me of the folks that think the lunar landing was a hoax. It has been said that realistically, the act of convincingly faking the moon landing would be a far greater challenge than actually making the trip.
Manipulating a market of thousands of stocks with millions of buyers and sellers so that it perfectly suits the needs of a few MMs is a similar endeavor. The MMs do have many ways to try, but at the end of the day, if the market collectively decides we’re going to the moon, then that’s where we’re going.
Given the complexity of it all, it’s quite laughable how the news tries to sum up the market direction with one simple reason like tariffs, China, brexit, etc. Sure, those events can be catalysts, but something as complex as thousands of stocks being bought and sold by millions of individuals just can’t be rationally understood.
In fact it’s precisely all that “rational” thinking (ie. bear markets are below the 200 dma, letting profits run, always use stops, etc.) that always got me into trouble… far worse trouble than the drawdown we experienced last year.
Drawdown is a fact of trading, period.
If you find that as a trader you just don’t have the patience for it, then you may want to consider taking a hiatus yourself until you figure out how to get some. But don’t worry. The market will always be waiting for you when you’re ready to come back. -MD
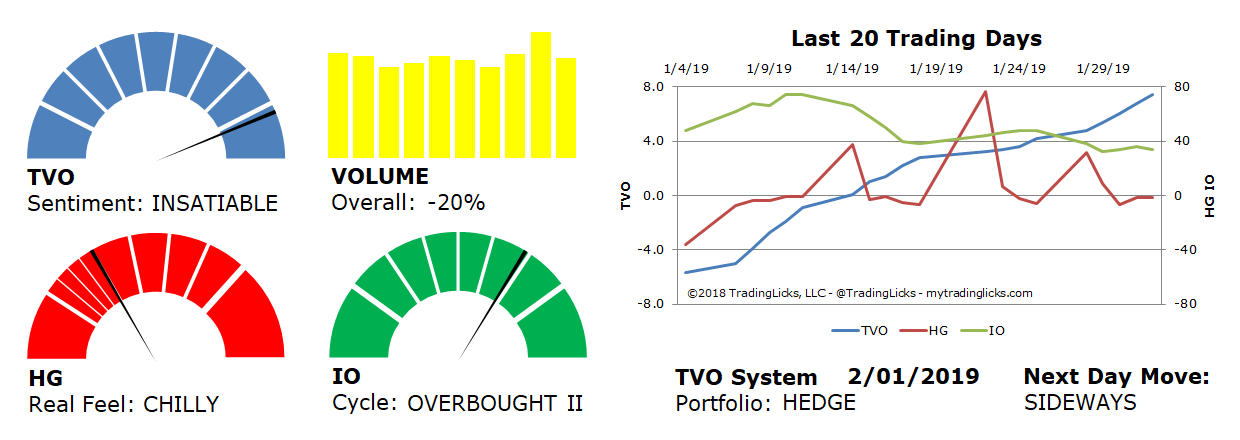
Sentiment: INSATIABLE – Big institutions are buying like there’s no tomorrow.
Volume: -20% – Today’s volume was lower than the previous session.
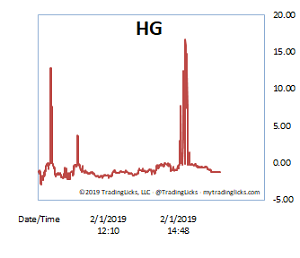
Real Feel: CHILLY – Bulls were in control of the session with substantial selling under the surface.
Cycle: OVERBOUGHT II – Retail investors are overly cocky and heavily positioned in their holdings.
Portfolio: HEDGE – The market is over saturated and long-term investments warrant some protection.
Next Day Move: SIDEWAYS -Â The probability that SPY will close positive in the next session is 53%.
Want to read more? Join our list. It's free.
For the full rundown on today's active signals and options trades, please log in. Not a Member? Join us today.
To view past positions check out our Trade History.
To find out what the indicators mean, visit our Market Volume Volume Barometer.
To learn more about market volume and how we trade, find us on Twitter (@TradingLicks) and StockTwits!
The indicator descriptions in the above graphic represent general market sentiment. The actual TVO System signals and trades are listed below in the Members Area. To view, please Login. Not a Member? Join us.