When HG says UP, don’t think twice. TVO MB 3-11
Markets soared on Monday and in the same breath left not only the 200 day, but also the 50 day MA behind in the dust. For every bear who cheered the 200 day break, there were twice as many bulls ready and waiting at the 50.
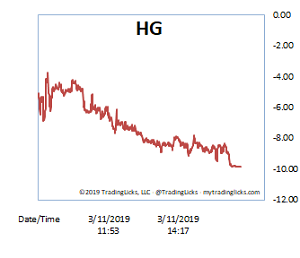
On the volume side of things, our Heat Gauge picked up on the buying activity last week and we were able to close out our SPY calls from Friday for a +35% gain.
Many folks ponder over whether it’s wise to take on such a position right before the weekend. When HG says UP, though, as far as going long, I rarely give it a second thought.
Knowing when to sell is sometimes a much more complicated process, but in general, selling into strength (and buying into weakness) is a time proven formula. I’m sure you’ve heard that before, but take it from someone who’s tested every theory under the sun… It’s one of the few things you’ve heard of that actually works.
While there was an increase in volume over most of the indices, volume actually fell on the Nasdaq, so, sorry bulls, there’s no claim on the day to accumulation (and the one glimmer hope for the bears to come out of Monday’s session).
Another thing to keep an eye on is there are now 2 unfilled gaps below (SPY 272 and 275). TVO is also getting close to zero (IO is already negative), so it would be no surprise to see SPY setting up to trade in a 10 point range for a while. -MD
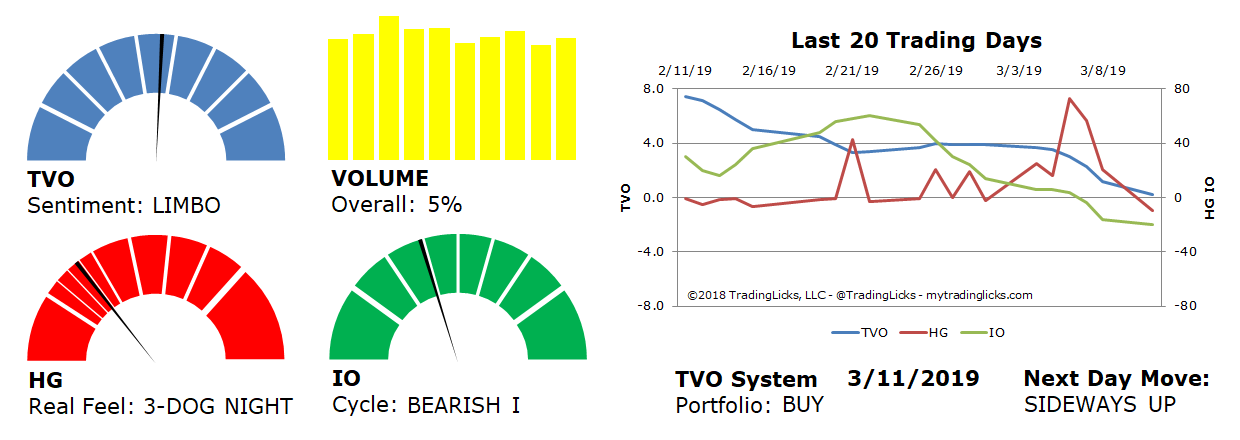
Sentiment: LIMBO – Markets are neutral and sentiment can go either way from here.
Volume: 5% – Today’s volume was higher than the previous session.
Real Feel: 3-DOG NIGHT – Bulls dominated the session with selling kept to a bare minimum under the surface.
Cycle: BEARISH I – Retail investors are uncertain and very light in their holdings.
Portfolio: BUY – The market is healthy and it’s a good time to contribute to long-term investments.
Next Day Move: SIDEWAYS UP – The probability that SPY will close positive in the next session is 56%.
Want to read more? Join our list. It's free.
For the full rundown on today's active signals and options trades, please log in. Not a Member? Join us today.
To view past positions check out our Trade History.
To find out what the indicators mean, visit our Market Volume Volume Barometer.
To learn more about market volume and how we trade, find us on Twitter (@TradingLicks) and StockTwits!
The indicator descriptions in the above graphic represent general market sentiment. The actual TVO System signals and trades are listed below in the Members Area. To view, please Login. Not a Member? Join us.