What’s between here and SPY 287? – TVO MB 3-18
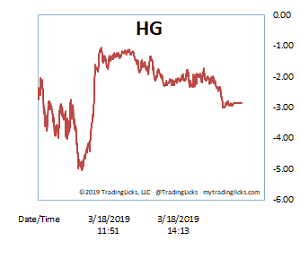
The price action was quite decisive on Monday as markets await this week’s Fed announcement. The overhead resistance the bears were counting on is all but melting away at this point. As far as volume, with the exception of a late morning interruption, the Heat Gauge stayed in the bullish CHILLY zone for the length of the session.
As prior price levels become broken, resistance becomes more psychological, with every whole number on SPY being the next obstacle… 282, 283, 284, etc. When the whole numbers game is all that’s left between here and SPY 287, things can really begin to accelerate.
Oh and for all the Head and Shoulders bears out there: Check back with me when SPY hits 287… I know that you know that this pattern really needs more symmetry.
The large volume drop today may imply that things are losing steam, but don’t let low volume fool you. The effect of Friday’s enormous volume boost is enough to last for quite sometime. Just think of it as taking one deep breath, then letting out a long and slow exhale. -MD
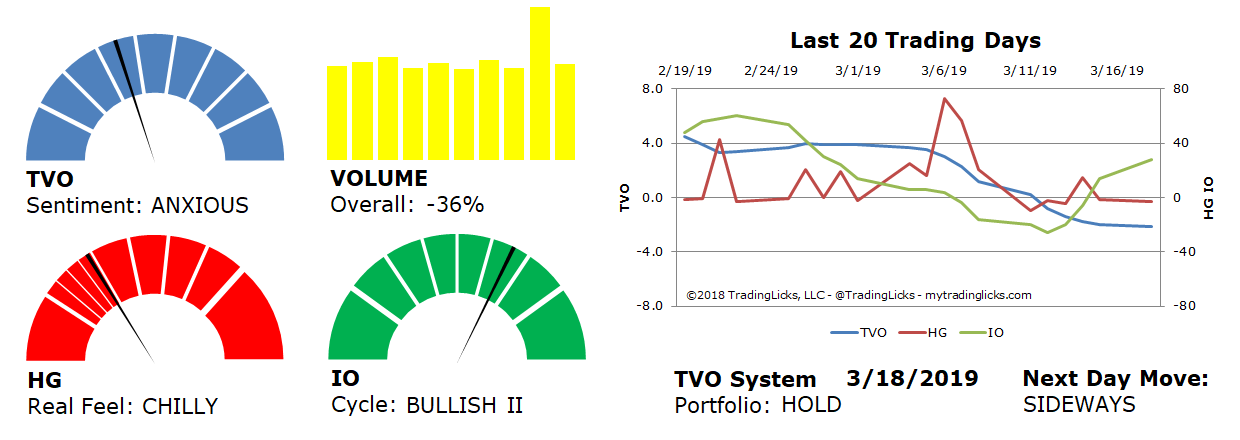
Sentiment: ANXIOUS – Markets are in a distribution phase where big institutions are selling to reduce their exposure.
Volume: -36% – Today’s volume was lower than the previous session.
Real Feel: CHILLY – Bulls were in control of the session with substantial selling under the surface.
Cycle: BULLISH II – Retail investors are overly cocky and heavily positioned in their holdings.
Portfolio: HOLD – The market is in a period of indecisiveness and the best place is on the sidelines.
Next Day Move: SIDEWAYS – The probability that SPY will close positive in the next session is 53%.
Want to read more? Join our list. It's free.
For the full rundown on today's active signals and options trades, please log in. Not a Member? Join us today.
To view past positions check out our Trade History.
To find out what the indicators mean, visit our Market Volume Volume Barometer.
To learn more about market volume and how we trade, find us on Twitter (@TradingLicks) and StockTwits!
The indicator descriptions in the above graphic represent general market sentiment. The actual TVO System signals and trades are listed below in the Members Area. To view, please Login. Not a Member? Join us.