TVO Market Barometer 7-16: Will SPY finally breakout this week?
Breakouts need volume to succeed and Monday on the big board there was plenty of it (a good 7% increase from last Friday). Most of it, though, was in the declining category, which led to a bit of distribution.
At the end of the session, however, the S&P 500 didn’t move much which hints that there’s a bit of churning going on beneath the surface. Churning often precedes a big move, but the direction of the move remains to be seen at this point.
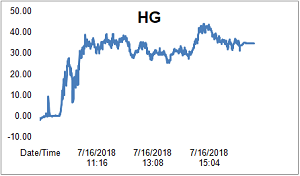
Our Heat Gauge has been telling us for 2 days that the next move in the short-term is “UP”. Now we’re not fortune tellers, but we are in the business of probability, and based on over a decade of volume data there’s close to a 60% chance that UP is where this will go.
And as for the much-anticipated SPY 280 breakout? Volume, unlike price, is a leading indicator, so very often it comes in well before the breakout. This often leaves potential shorts scratching their heads as to how and why things continue to go up when there’s seemingly little or no volume to fuel the move.
Whether this happens on Tuesday is anyone’s guess, but it doesn’t take a palm reading to assess your odds, control your risk and trade accordingly. -MD
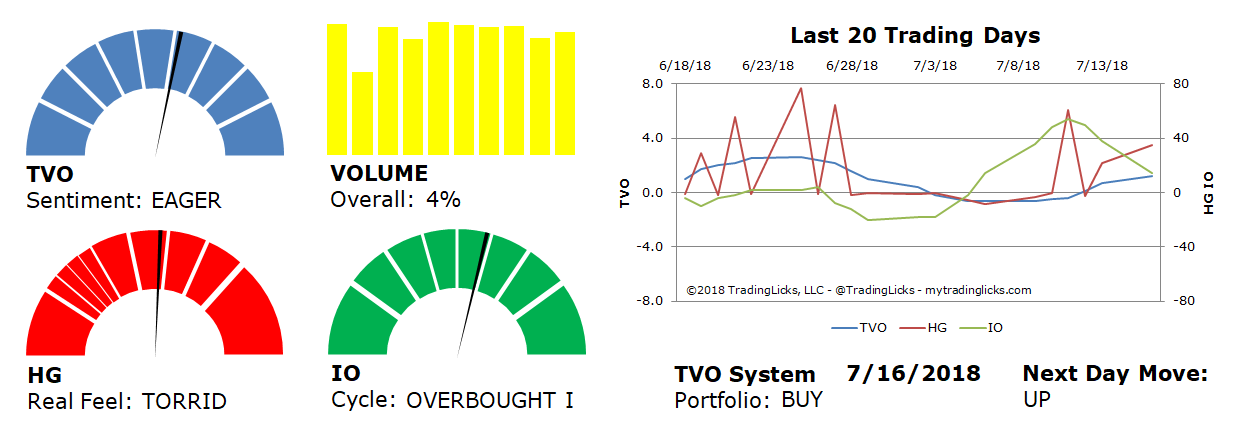
Sentiment: EAGER – Markets are in accumulation mode and big institutions are buying at a slow and steady pace.
Volume: 4% – Today’s volume was higher than the previous session.
Real Feel: TORRID – Bears were in control of the session with moderate buying under the surface.
Cycle: OVERBOUGHT I – Retail investors are confident and slightly overweight in their holdings.
Portfolio: BUY – The market is healthy and it’s a good time to contribute to long-term investments.
Next Day Move: UP -Â The probability that SPY will close positive in the next session is 59%.
Want to read more? Join our list. It's free.
For the full rundown on today's active signals and options trades, please log in. Not a Member? Join us today.
To view past positions check out our Trade History.
To find out what the indicators mean, visit our Market Volume Volume Barometer.
To learn more about market volume and how we trade, find us on Twitter (@TradingLicks) and StockTwits!
The indicator descriptions in the above graphic represent general market sentiment. The actual TVO System signals and trades are listed below in the Members Area. To view, please Login. Not a Member? Join us.