TVO Market Barometer 2-12: Have we gotten to the bottom of it all?
Markets surged on Monday as the bulls made a valiant move to reclaim some of last week’s drop. There’s still quite a bit of ground before the 50 day MA (and to the level that some would call a “return to normal”), and right now volume, and institutional support, is not on the bull’s side.
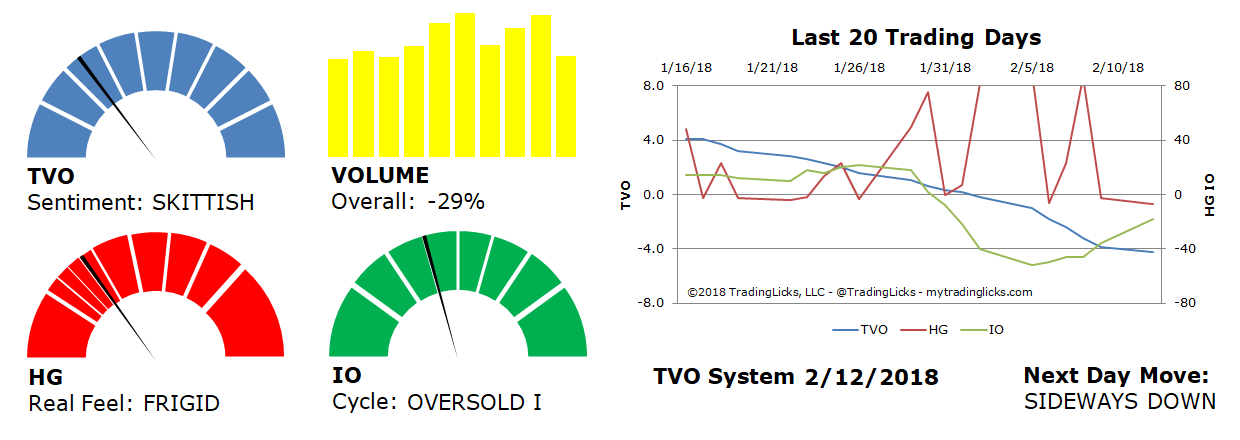
Overall volume dropped almost -30%, and our Heat Gauge is at a level where the Next Day Move is likely SIDEWAYS DOWN. But yet, there are certain Wall Street experts out there saying this sure looks like a bottom. Nothing against those folks, but when many eyes think they see something with that much confidence, well, that is often a clear warning that the opposite is more likely to be true.
There are opinions and then there are statistics.
Out of the last 7 market corrections (of -10% or more), TVO correctly identified the bottom in 6 of them. In most of those cases, the signal was early, but we still managed to capture most of the ride back to all-time highs. Where is TVO now? At -4.2 and sinking, the oscillator still has room to decline before making some kind of reversal, so we still have a bit more time before TVO makes the call on this one. -MD
Want to read more? Join our list. It's free.
For the full rundown on today's active signals and options trades, please log in. Not a Member? Join us today.
To view past positions check out our Trade History.
To find out what the indicators mean, visit our Market Volume Volume Barometer.
To learn more about market volume and how we trade, find us on Twitter (@TradingLicks) and StockTwits!
The indicator descriptions in the above graphic represent general market sentiment. The actual TVO System signals and trades are listed below in the Members Area. To view, please Login. Not a Member? Join us.