TVO Market Barometer 1-2: How much of an “effect” does January have?
The “January Effect” officially kicked off with a bang on Tuesday as both the S&P 500 and the Nasdaq (now at an unprecedented 7006) ended the session at all time highs. Apparently last week’s one final “last day of the year tax selling” was good enough to spark this new year’s rally and set the tone for 2018.
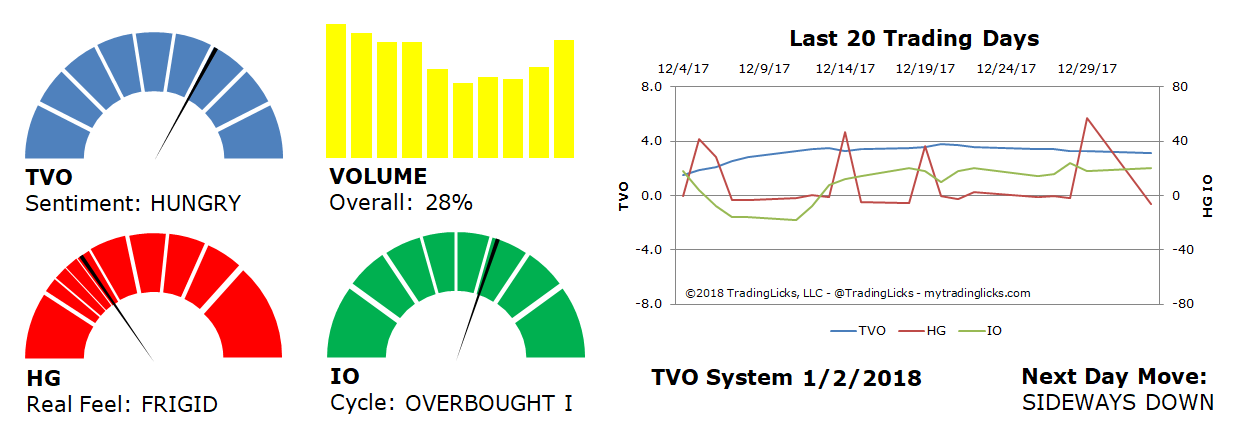
But how much spark is really there to keep this going for the rest of the month? Or the rest of the year, for that matter? Well, TVO, our volume oscillator, is still moving towards zero, so volume-wise, today’s buying may not be enough to shift the tide away from what’s looking like more range bound action to come, or possibly a short-term pullback.
HG, our Heat Gauge, did give us a bearish DOWN reading last Friday, and today was SIDEWAYS DOWN… which means it’s time to go short, right? If that thought has crossed your mind (or entered your gut) recently, here are the 2 rules at the core of our trading philosophy that helped us gain a total account return of over +27% in 2017:
1. Never short a bull market
2. Whenever there’s a correction, refer to rule #1
When it’s clear that big institutions are accumulating, it’s best to either follow their lead or stay out of the way until the shakeout/pullback comes around. How do we know if it’s accumulation or distribution? While most folks look at price, we use an original algorithm based strictly on volume that tells us exactly when the big boys are in (or out) of town.
How do you know if the dip is buyable and not the beginning of a greater correction? Well, you have the above rule #2, and if you’ve done your backtesting homework (and in our case a number of years of live trading on top of that), you’ve got some solid probability and statistics to base your signals on.
It may not be the most exciting way to trade, but a consistent rules based approach beats trusting your gut hands down and will allow you to stay in the game… Long after the effect of January (and how it’s affected your account) has run it’s course.
Many thanks to all the faithful readers of this blog and “volume followers” out there for helping to make 2017 such a stellar year. Wishing all of you the best of success in 2018! -MD
Want to read more? Join our list. It's free.
For the full rundown on today's active signals and options trades, please log in. Not a Member? Join us today.
To view past positions check out our Trade History.
To find out what the indicators mean, visit our Market Volume Volume Barometer.
To learn more about market volume and how we trade, find us on Twitter (@TradingLicks) and StockTwits!
The indicator descriptions in the above graphic represent general market sentiment. The actual TVO System signals and trades are listed below in the Members Area. To view, please Login. Not a Member? Join us.