TVO Market Barometer 1-16: This time it’s different
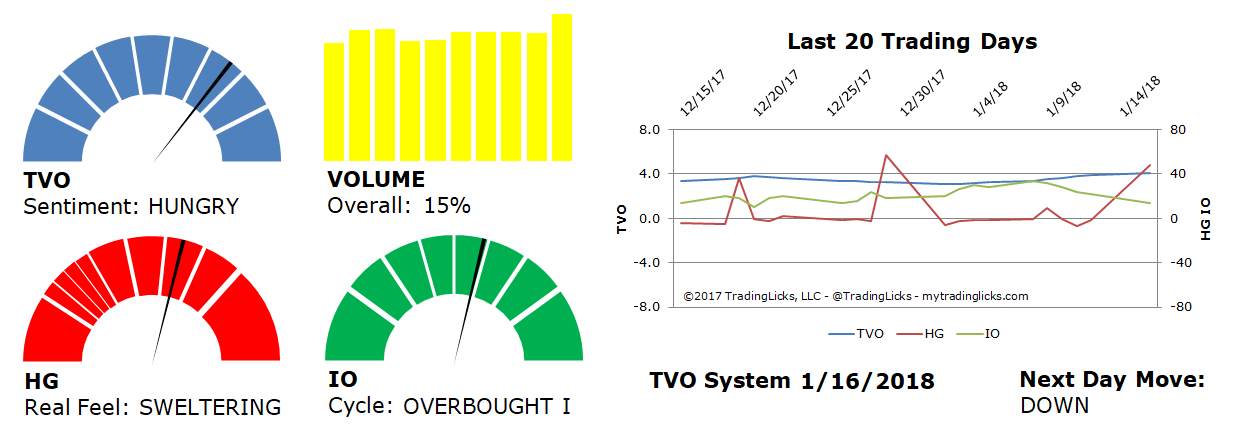
On the last trading day of 2017, our Heat Gauge was SWELTERING and indicated that the Next Day Move (which was the first trading day of 2018) would be DOWN. Even though it was the first across-the-board distribution day since October, the move that followed was decisively to the upside in a big way (Our DOWN signal was about 56% correct last year, but more on that in another post).
Tuesday’s HG was SWELTERING once again, but before you start loading up on calls for the next 2 week run up, there’s more to the volume story this time around. At the end of ’17, TVO, our Total Volume Oscillator, was just above 3.0, which is somewhat overbought in the longer term, but still has room for potential upside. Right now we’re not that much higher (4.1), however, even if we have the same kind of 2-3 day accumulation rally, the oscillator (according to a forward testing analysis) will almost certainly reverse direction… in which case look out below.
Why do we care so much about volume to the point where we tune out everything else including price? Because volume is truly a leading indicator. When volume shifts, prices follow. Does it work like that all the time? Well, our entire trading system is built on that premise and we maintain a long-term success rate of 70% (If you’re among the so-called 90%-ers, hopefully you’ll be wise enough to cash out before your win streak runs out).
So it must be time to load up on puts then, right? Even though Tuesday was another across-the-board distribution day, they are still few and far between. The bull market is still very much intact, so we remain in cash until volume tells us otherwise. -MD
Want to read more? Join our list. It's free.
For the full rundown on today's active signals and options trades, please log in. Not a Member? Join us today.
To view past positions check out our Trade History.
To find out what the indicators mean, visit our Market Volume Volume Barometer.
To learn more about market volume and how we trade, find us on Twitter (@TradingLicks) and StockTwits!
The indicator descriptions in the above graphic represent general market sentiment. The actual TVO System signals and trades are listed below in the Members Area. To view, please Login. Not a Member? Join us.