SPY 280: Cause for alarm or 4 times a charm? – TVO MB 2-20
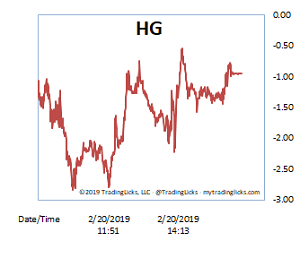
The Heat Gauge was CHILLY once again on Wednesday, and despite the algo attempts around the Fed announcement, advance/decline volume stayed bullishly unfazed in a narrow range. Even though overall volume did get a boost, today’s action on the Nasdaq fell shy of the accumulation category.
In general terms, a high volume/narrow range day is said to be “churning” under the surface. These kinds of days almost always precede a much larger move.
Yes, you read that correctly. We’re setting up now before the big move, not at the end of it. Unless of course, the big move turns out to be down.
At this point, though, it’s looking like both bulls and bears want SPY 280 (each for different reasons, obviously), so getting there is a given. Technical lore says that every time a level is tested, the more likely it is to break, and this will be the 4th test since last October. Whether or not we simply glide on through it remains to be seen. But so far this time, slow and steady is winning the race. -MD
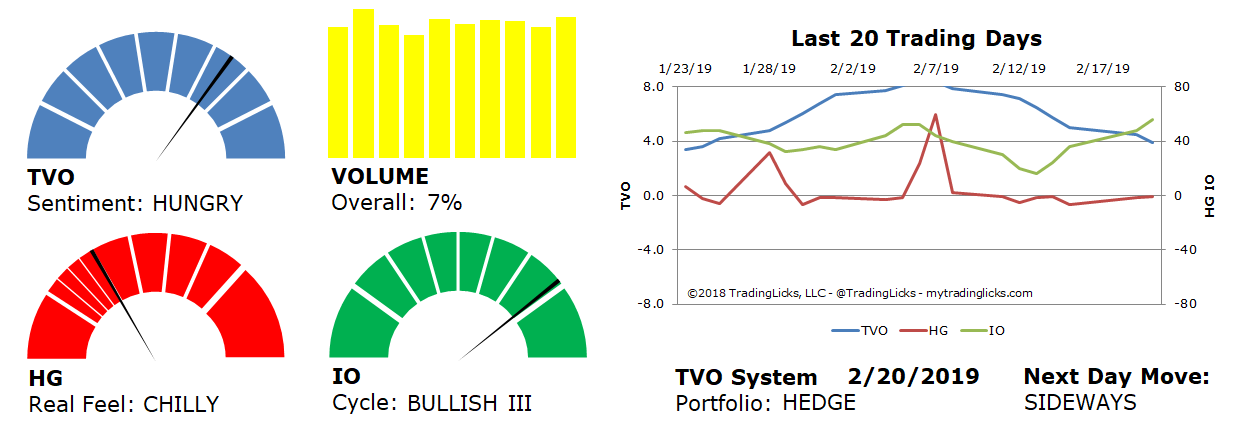
Sentiment: HUNGRY – Markets are accumulating at an accelerated rate and big institutional buying is heavy and aggressive.
Volume: 7% – Today’s volume was higher than the previous session.
Real Feel: CHILLY – Bulls were in control of the session with substantial selling under the surface.
Cycle: BULLISH III – Retail investors have bitten off way more than they can chew.
Portfolio: HEDGE – The market is over saturated and long-term investments warrant some protection.
Next Day Move: SIDEWAYS -Â The probability that SPY will close positive in the next session is 53%.
Want to read more? Join our list. It's free.
For the full rundown on today's active signals and options trades, please log in. Not a Member? Join us today.
To view past positions check out our Trade History.
To find out what the indicators mean, visit our Market Volume Volume Barometer.
To learn more about market volume and how we trade, find us on Twitter (@TradingLicks) and StockTwits!
The indicator descriptions in the above graphic represent general market sentiment. The actual TVO System signals and trades are listed below in the Members Area. To view, please Login. Not a Member? Join us.