Just when I thought I was out, they pull me back in. – TVO MB 2-13
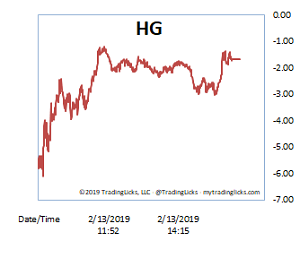
SPY convincingly broke through the 200 day MA on Wednesday, only to be smacked down to just above the opening gap. Volume on the other hand was relatively unhinged as HG spent most of the day in the CHILLY range, which typically indicates consolidation.
Overall volume did drop in the session, so the bulls can’t lay claim to any accumulation, but the apparent lack of anything bearish (other than resistance at 276) is enough of a notch in their Dow 26k caps for now.
But what’s so significant about SPY 276, anyway?
I decided a long time ago that the support/resistance numbers game is a far too erratic and time-consuming pursuit in trading (and a reason behind why we don’t use stops). Sometimes your favorite stock/ETF hits the number perfectly and sometimes it slices right through it like it’s not even there.
And then you hear folks say it’s not the resistance level, but rather how the market reacts that’s important.
What exactly is that supposed to mean? When good news becomes bad news and vice versa, how do we know which reaction is the “right” one? The plain answer is that numbers are just hard-wired into the human psyche, and that we will all make of them what we will. -MD
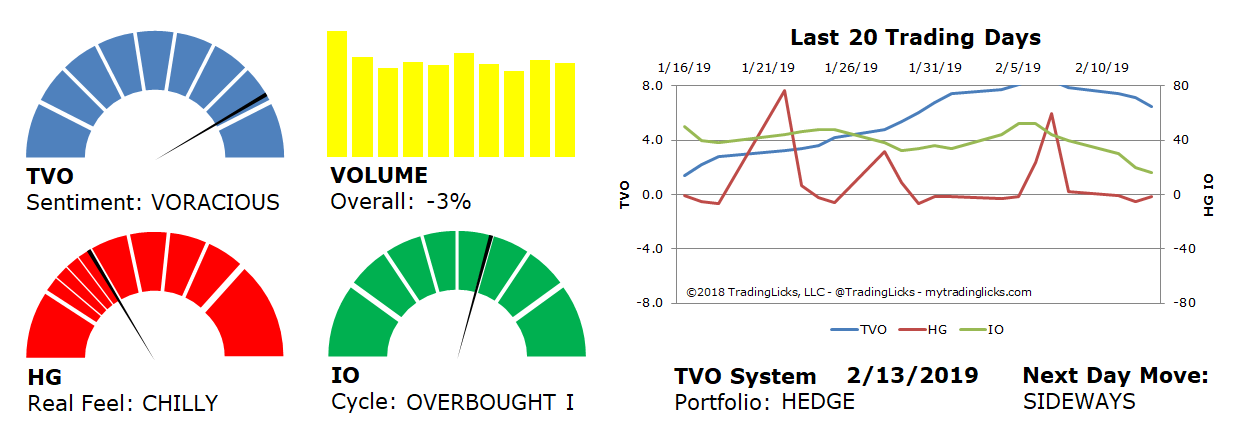
Sentiment: VORACIOUS – Big institutions are buying like there’s no tomorrow.
Volume: -3% – Today’s volume was lower than the previous session.
Real Feel: CHILLY – Bulls were in control of the session with substantial selling under the surface.
Cycle: OVERBOUGHT I – Retail investors are confident and slightly overweight in their holdings.
Portfolio: HEDGE – The market is over saturated and long-term investments warrant some protection.
Next Day Move: SIDEWAYS -Â The probability that SPY will close positive in the next session is 53%.
Want to read more? Join our list. It's free.
For the full rundown on today's active signals and options trades, please log in. Not a Member? Join us today.
To view past positions check out our Trade History.
To find out what the indicators mean, visit our Market Volume Volume Barometer.
To learn more about market volume and how we trade, find us on Twitter (@TradingLicks) and StockTwits!
The indicator descriptions in the above graphic represent general market sentiment. The actual TVO System signals and trades are listed below in the Members Area. To view, please Login. Not a Member? Join us.