Gap and go or more of the same? – TVO MB 2-11
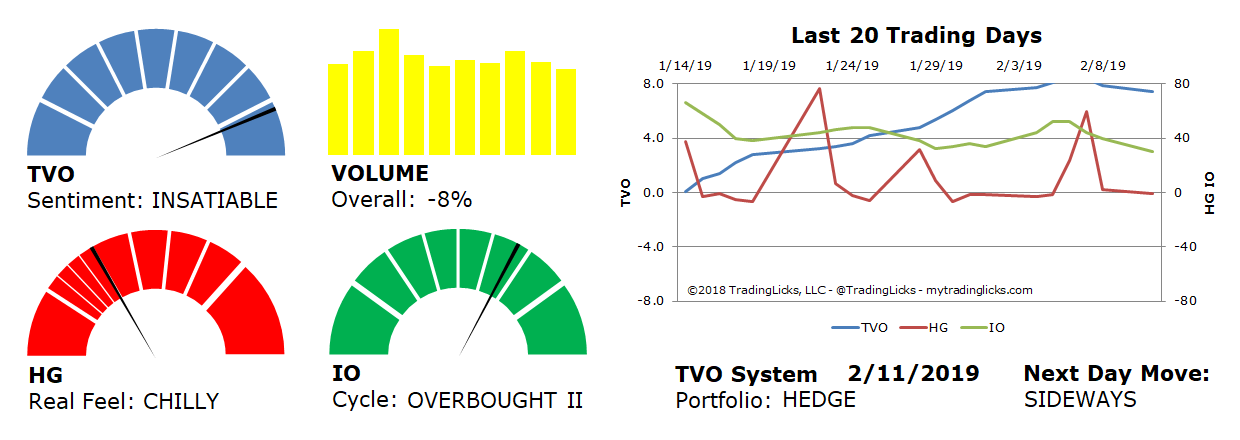
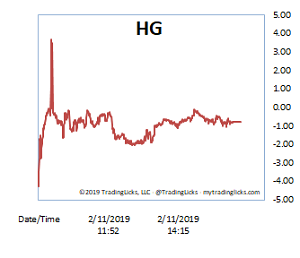
Without even looking at a price chart, it’s clear to see on the Heat Gauge that most of the action in Monday’s session happened in the first hour of trading. There was an overnight futures gap that was quickly sold, as HG went from -4 to +4 then settling in around a CHILLY -1.
That’s a pretty decent volume spike, but not anywhere near the magnitude we saw last week prior to the pullback. The rest of the day adhered to the SIDEWAYS plan, and it looks like more of the same for Tuesday.
I wouldn’t be surprised to see SPY form a range (or dare I say a “Darvas Box”) just below the 200 day MA before deciding on its next move… Even with all the “shutdown averted” news pumping the airwaves this evening.
And right now with hardly any distribution to speak of, the direction of the longer-term move by default would be very likely be UP. But depending on how long we stay in this range (which is usually longer than most folks can stand), there may need to be one more quick flush before we get things underway. -MD
Sentiment: INSATIABLE – Big institutions are buying like there’s no tomorrow.
Volume: -8% – Today’s volume was lower than the previous session.
Real Feel: CHILLY – Bulls were in control of the session with substantial selling under the surface.
Cycle: OVERBOUGHT II – Retail investors are overly cocky and heavily positioned in their holdings.
Portfolio: HEDGE – The market is over saturated and long-term investments warrant some protection.
Next Day Move: SIDEWAYS -Â The probability that SPY will close positive in the next session is 53%.
Want to read more? Join our list. It's free.
For the full rundown on today's active signals and options trades, please log in. Not a Member? Join us today.
To view past positions check out our Trade History.
To find out what the indicators mean, visit our Market Volume Volume Barometer.
To learn more about market volume and how we trade, find us on Twitter (@TradingLicks) and StockTwits!
The indicator descriptions in the above graphic represent general market sentiment. The actual TVO System signals and trades are listed below in the Members Area. To view, please Login. Not a Member? Join us.