Did smart money just buy the retail sales dip? – TVO MB 2-14
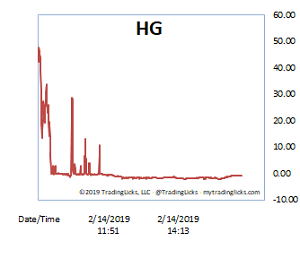
Retail sales dropped in December and so did markets at the open on Thursday. The huge spike in volume on the Heat Gauge that went with it, though, quickly settled into almost a perfectly CHILLY flat line for the rest of the session.
Under the hood, the Nasdaq (which is generally viewed as a leading index) logged a volume accumulation day.
Was the Sales report all just fake news? Well, more likely, some of the worrying “global recession” folks just lightened their positions a bit while the majority of the big players still have most of their skin in the game.
TVO is picking up more speed as it heads back down to zero. What this basically means is that the current volume cycle of heavy institutional buying is coming to a close. What it DOESN”T necessarily mean is that a wave of selling is set to begin. Indices could very well drift in a range until the next round of accumulation starts.
I’m getting tired of talking about it, but here it goes again… the 200 day MA is historically an area of heavy buying activity. Accumulation on the Nasdaq today even with poor retail sales data is showing exactly that, as smart money is still looking at tech names as bargains and buying on pullbacks. Follow the leader and trade accordingly. -MD
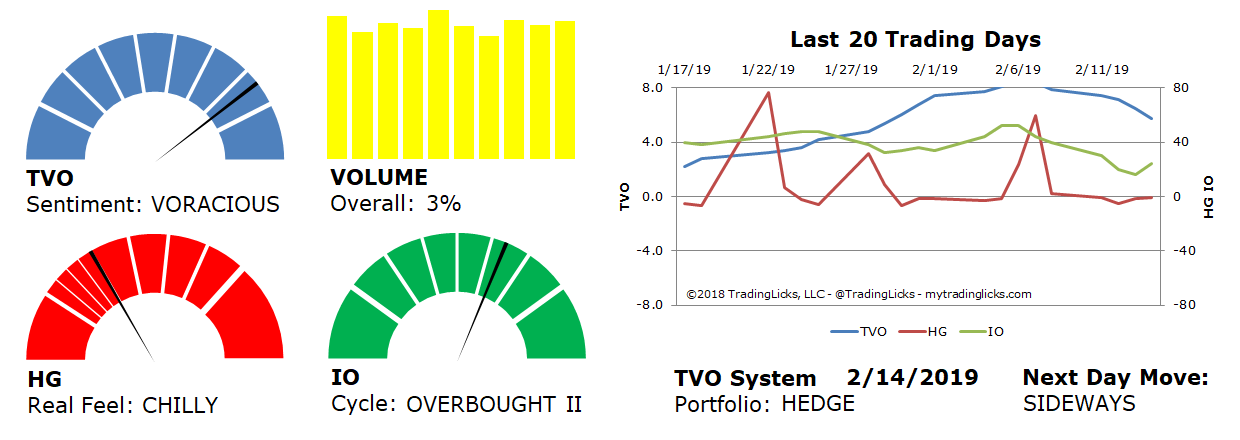
Sentiment: VORACIOUS – Big institutions are buying like there’s no tomorrow.
Volume: 3% – Today’s volume was higher than the previous session.
Real Feel: CHILLY – Bulls were in control of the session with substantial selling under the surface.
Cycle: OVERBOUGHT II – Retail investors are overly cocky and heavily positioned in their holdings.
Portfolio: HEDGE – The market is over saturated and long-term investments warrant some protection.
Next Day Move: SIDEWAYS -Â The probability that SPY will close positive in the next session is 53%.
Want to read more? Join our list. It's free.
For the full rundown on today's active signals and options trades, please log in. Not a Member? Join us today.
To view past positions check out our Trade History.
To find out what the indicators mean, visit our Market Volume Volume Barometer.
To learn more about market volume and how we trade, find us on Twitter (@TradingLicks) and StockTwits!
The indicator descriptions in the above graphic represent general market sentiment. The actual TVO System signals and trades are listed below in the Members Area. To view, please Login. Not a Member? Join us.