Back To The 50 Day Or Down To The 200?
There was a bit of distribution on the big board in Monday’s session (overall volume barely budged), even though the mention of tariffs seems to have taken a back seat other important matters… like the Game of Thrones finale for instance. Last Friday’s selling, however, was firmly across-the-board, as distribution days are now steadily starting to rack up.
Some folks still insist on blaming it all on the trade war. For future generations of traders, though, their in-depth chart analysis of the past 20 days will probably be summed up something like, “Well, it looks like they sold in May and went away.”
In the midst of all the recent red days, last Thursday actually logged some accumulation… Which is exactly what markets are known to do at the 50 day moving average. The Fed is on tap this week which many see as a positive catalyst for the bulls, but it really depends on whether the S&P 500 can stay afloat near the 50 day line. If not, the 200 day MA is the next stop. -MD
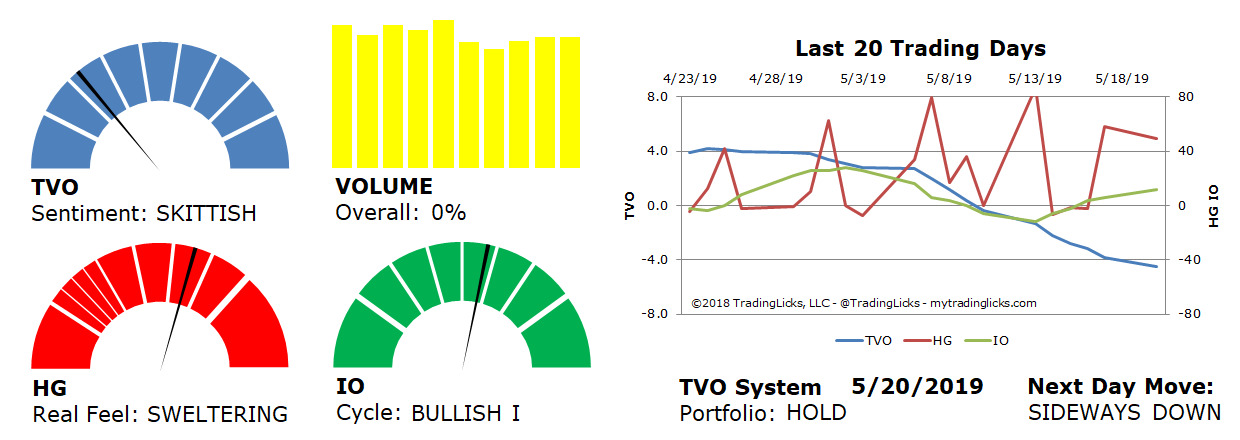
Sentiment: SKITTISH – Market distribution is heavy and aggressive and big institutions are selling to preserve their capital.
Volume: 0% – Today’s volume was higher than the previous session.
Real Feel: SWELTERING – Bears were in control of the session with a slight trace of buying under the surface.
Cycle: BULLISH I – Retail investors are confident and slightly overweight in their holdings.
Portfolio: HOLD – The market is in a period of indecisiveness and the best place is on the sidelines.
Next Day Move: SIDEWAYS DOWN -Â The probability that SPY will close positive in the next session is 53%.
Want to read more? Join our list. It's free.
For the full rundown on today's active signals and options trades, please log in. Not a Member? Join us today.
To view past positions check out our Trade History.
To find out what the indicators mean, visit our Market Volume Volume Barometer.
To learn more about market volume and how we trade, find us on Twitter (@TradingLicks) and StockTwits!
The indicator descriptions in the above graphic represent general market sentiment. The actual TVO System signals and trades are listed below in the Members Area. To view, please Login. Not a Member? Join us.