Are they selling in May or are they here to stay?
May is almost upon us and looking back, the month of April faithfully delivered what it’s historically known for… Market gains (“April showers” has a slightly different connotation on Wall Street).
And now that we satisfied that expectation, what will the month of May bring? Looking at the potentially tumultuous week ahead, (Wednesday is the Fed and Friday is the job numbers) on the surface it seems like it’s the perfect bearish setup for the beginning of “Sell in May and go away.”
If we take a look at what’s brewing under the hood, however, things are much more complacent at the moment.
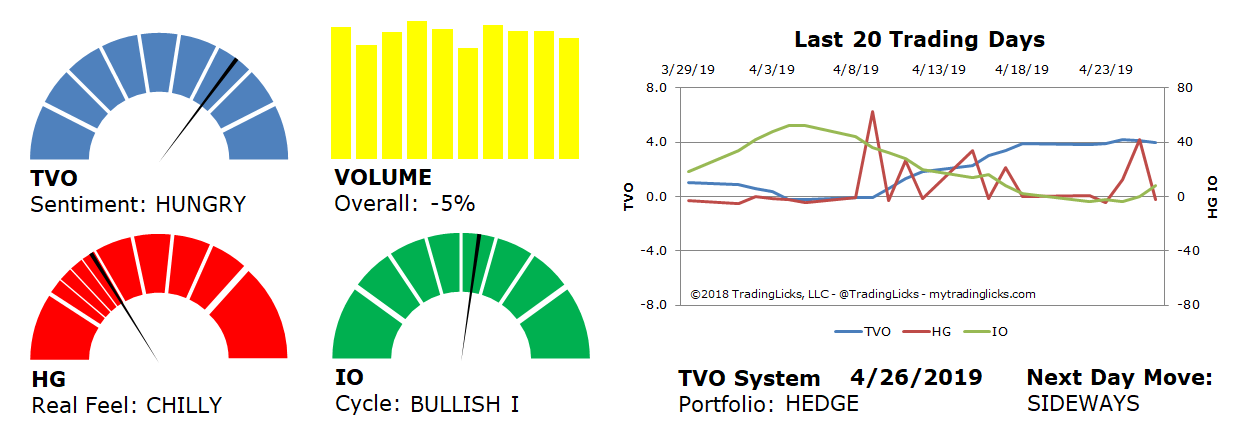
It’s been almost exactly a month since the last across-the-board distribution day, and TVO, our volume oscillator has been steadily on the rise ever since. In the last few sessions, though, overall volume has been on a decline, so it looks like institutional buying is slowly losing steam.
Does this mean they’re getting ready to go away?
Well, as we’ve mentioned before, TVO (now at 4.0) still has room to run (over 5.0 is where bulls need to be concerned), but the oscillator values are now convincingly headed down towards zero.
And where volume goes, prices soon follow.
The “blink and you missed it” dip buying can certainly continue in the short-term, but unless the accumulation phase suddenly recharges its batteries (which is unlikely at this level), we can expect to see some profit taking… at least until the May flowers come in. -MD
Sentiment: HUNGRY – Markets are accumulating at an accelerated rate and big institutional buying is heavy and aggressive.
Volume: -5% – Today’s volume was lower than the previous session.
Real Feel: CHILLY – Bulls were in control of the session with substantial selling under the surface.
Cycle: BULLISH I – Retail investors are confident and slightly overweight in their holdings.
Portfolio: HEDGE – The market is over saturated and long-term investments warrant some protection.
Next Day Move: SIDEWAYS – The probability that SPY will close positive in the next session is 53%.
Want to read more? Join our list. It's free.
For the full rundown on today's active signals and options trades, please log in. Not a Member? Join us today.
To view past positions check out our Trade History.
To find out what the indicators mean, visit our Market Volume Volume Barometer.
To learn more about market volume and how we trade, find us on Twitter (@TradingLicks) and StockTwits!
The indicator descriptions in the above graphic represent general market sentiment. The actual TVO System signals and trades are listed below in the Members Area. To view, please Login. Not a Member? Join us.