An October Crash Is Mostly Hot Air
Around this time of year, I always seem to come across the same kind of headlines. “Watch out for a correction in October,” or “The worst month for stocks is always October.” The latter almost always throws out a passing reference to either 2008 and/or 1987, two of the worst market declines in history. Do they use these examples just to prove their point or are they also intending to simply scare the bejesus out of all of us? Well you can be rest assured that this October we can safely save the scary stuff for Halloween (or at least until the holidays start).
Let’s take a look at some charts to see what’s really going on.

At first glance at the current chart of the S&P 500, it’s not a stretch to think that we’ve gone up for too long and now it’s time to come down. Under the hood, however, there’s a different picture unfolding. To get a better sense of the guts of the operation, I like to use the Total Volume Oscillator; an indicator I created to measure accumulation and distribution or the money flowing in and out of the market.
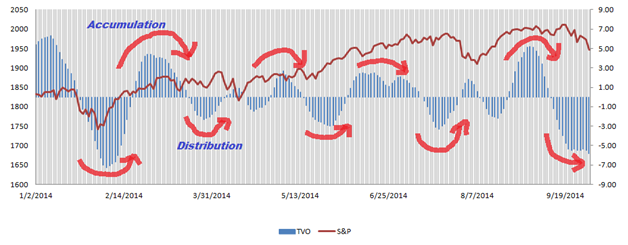
As you can see, the Total Volume Oscillator (TVO, indicated in blue), is showing a nice ebb and flow of accumulation and distribution since the beginning of the year. As the market rises the money changes hands. The profit takers make way for new buyers and the cycle continues. Now let’s take a look at the same chart, but for 2008.
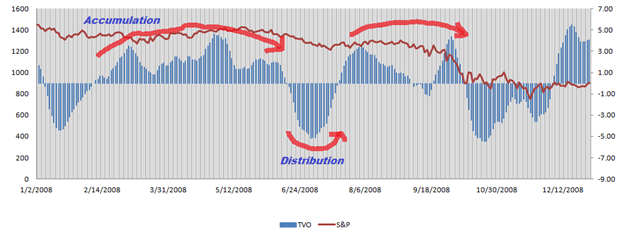
From February until June of ’08 we see pretty much all accumulation with not much relief from distribution until we had that big drop in (drum roll, please) October. I like to think of it sort of like a rising hot air balloon. If you keep going for too long you’ll burn up all your fuel and eventually come back to earth. Another thing you may have noticed (that seems to escape all the Red October hunters) is that the S&P was already in a decline at the beginning of the year, thus creating an even more perfect storm of sorts. That was then; this is now.
But what about 1987? We were in the midst of huge bull market just like we are now, so the comparison must be more valid, right? Well that ain’t necessarily so.
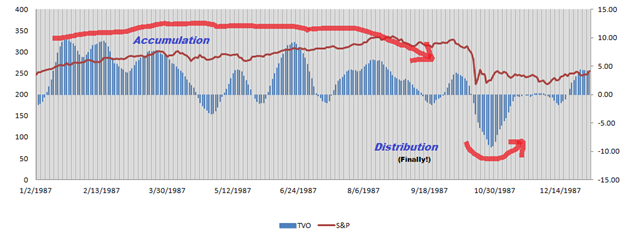
Compared to our hot air balloon in ’08, ’87 was more like the Hindenburg. The market went up, up and away almost all year with virtually no significant sign of selling or profit taking. By the time we got to Black Monday things were ready to blow sky high. So, yes it is true that what goes up must come down, and every October from now until the real doomsday, folks will be talking about this (Just like how my old neighbor used to reminisce about the Blizzard of ’78)… But as long as there’s a healthy balance between buyers and sellers, it’s unlikely that the blood red sky is gonna fall any time soon.