Has the parting of the Red Sea finally begun?
The Fed delivered no surprises on Wednesday, but nevertheless, investors sold the news right on cue just like they’re supposed to. And if that wasn’t enough, the drop just happened to coincide with the first of May, which is also right on cue for the “sell in May” exodus to begin.
Will markets stick to the script and continue to slide? Well, although the Nasdaq did log some distribution for the session, overall volume barely budged… not exactly the parting of the Red Sea the bears were hoping to see.
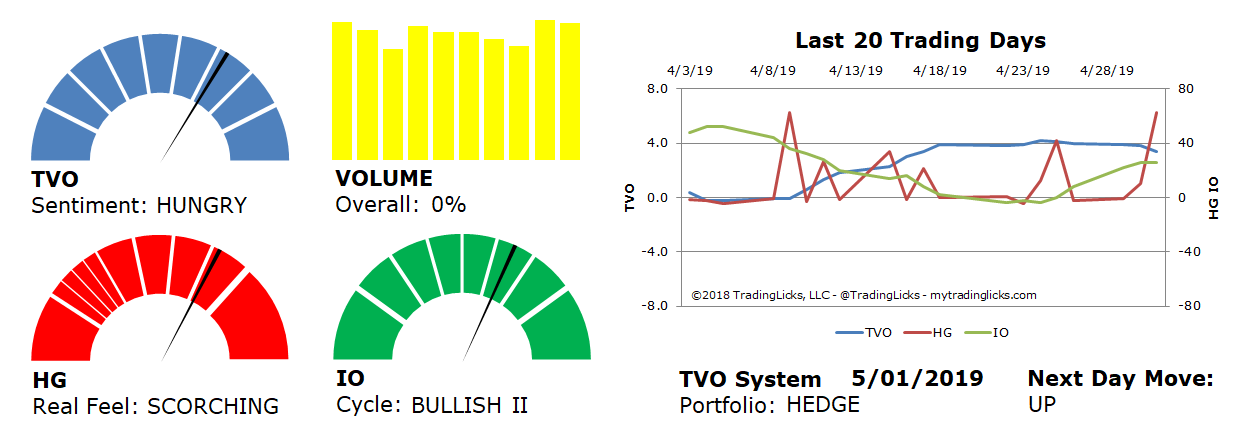
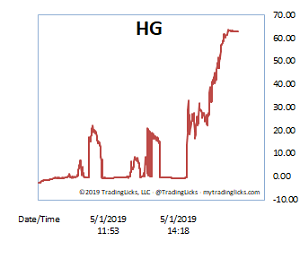
The May sell-off could still take place, but maybe at a slower pace rather than one fell swoop. If you look at our Heat Gauge over the past 2 weeks, though, large spikes of down volume intraday have been telling us that the slow withdrawal has already been happening. In fact, 2 huge spikes showed up today on HG prior to the Fed announcement, so the afternoon dive was no surprise to our members and to those that follow volume.
TVO, our longer term volume oscillator, continues to fall, however, if big institutions continue to hold their positions, we may see things level off in the bullish 0-3.0 range for a while. But if more sudden distribution takes hold in the near term, all bets for a smooth consolidation are off. For the time being, though, the Red Sea is holding up. -MD
Sentiment: HUNGRY – Markets are accumulating at an accelerated rate and big institutional buying is heavy and aggressive.
Volume: 0% – Today’s volume was lower than the previous session.
Real Feel: SCORCHING – Bears dominated the session with a minuscule amount of buying under the surface.
Cycle: BULLISH II – Retail investors are overly cocky and heavily positioned in their holdings.
Portfolio: HEDGE – The market is over saturated and long-term investments warrant some protection.
Next Day Move: UP -Â The probability that SPY will close positive in the next session is 59%.
Want to read more? Join our list. It's free.
For the full rundown on today's active signals and options trades, please log in. Not a Member? Join us today.
To view past positions check out our Trade History.
To find out what the indicators mean, visit our Market Volume Volume Barometer.
To learn more about market volume and how we trade, find us on Twitter (@TradingLicks) and StockTwits!
The indicator descriptions in the above graphic represent general market sentiment. The actual TVO System signals and trades are listed below in the Members Area. To view, please Login. Not a Member? Join us.