What’s behind all the gaps and fades?
Overnight futures caused the market to gap up at the open on Tuesday, and after a quick morning flush, prices almost completely recovered by the close. If this sounds familiar, it’s because the same thing has happened every day since last Thursday.
Well, the same thing price-wise that is…
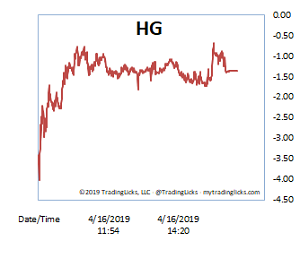
If you look at volume and our Heat Gauge, however, you’ll see a much different pattern: Lower volume on the “hotter” days and higher volume on the “cooler” ones. This is just the kind of ebb and flow (aka consolidation) that the bulls are hoping to see.
You may not think it’s possible, but institutions are indeed accumulating at these levels in the market. Whether most of the big buying happens at the open, intraday, or at the close really makes no difference in the long-term scheme of things. And just when you think they’ve settled in a predictable pattern, the indices will flip the script (There’s really no such thing as a “teachable moment” in the stock market).
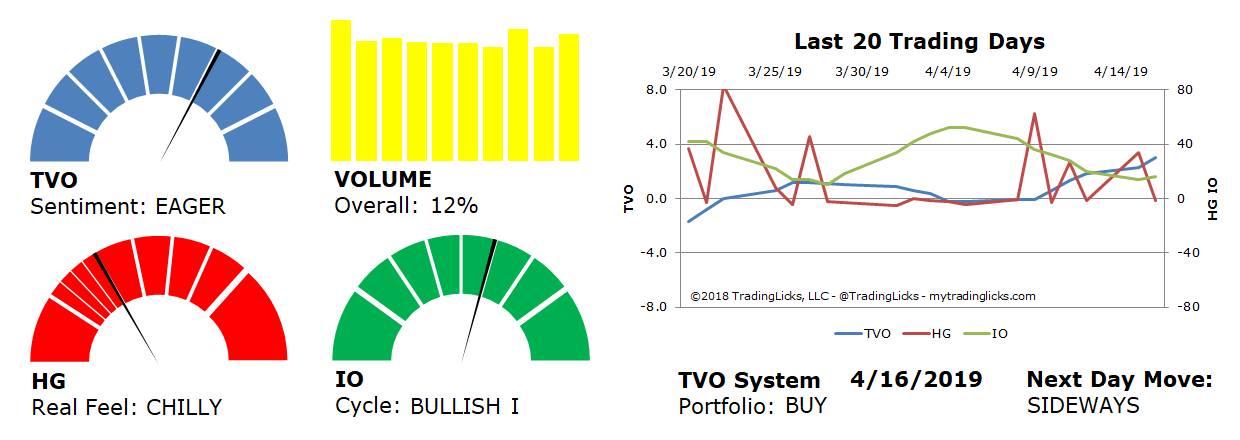
It’s looking like the Nasdaq has finally started to pull ahead and lead the pack (while so many are obsessed with S&P 2900, has anyone noticed COMPQ 8000?). As TVO continues to rise above 3.0, we’ll be watching for overbought conditions to take hold, but right now as far as volume goes, there’s plenty of room to run. -MD
Sentiment: EAGER – Markets are in accumulation mode and big institutions are buying at a slow and steady pace.
Volume: 12% – Today’s volume was higher than the previous session.
Real Feel: CHILLY – Bulls were in control of the session with substantial selling under the surface.
Cycle: BULLISH I – Retail investors are confident and slightly overweight in their holdings.
Portfolio: BUY – The market is healthy and it’s a good time to contribute to long-term investments.
Next Day Move: SIDEWAYS -Â The probability that SPY will close positive in the next session is 53%.
Want to read more? Join our list. It's free.
For the full rundown on today's active signals and options trades, please log in. Not a Member? Join us today.
To view past positions check out our Trade History.
To find out what the indicators mean, visit our Market Volume Volume Barometer.
To learn more about market volume and how we trade, find us on Twitter (@TradingLicks) and StockTwits!
The indicator descriptions in the above graphic represent general market sentiment. The actual TVO System signals and trades are listed below in the Members Area. To view, please Login. Not a Member? Join us.