Should we short 2800 on the S&P? The answer is obvious. – TVO MB 3-26
The moment of truth has come for the obvious head and shoulders pattern on the weekly chart of the S&P 500. And it’s uncanny how it all seems to line up perfectly with resistance at the 2800 area, the approaching “golden cross” (well it already happened on the Dow, but that really doesn’t count), and the constantly mentioned yield curve inversion. It’s a scenario that’s so obviously an ideal setup for a shorting opportunity…
Which is one of the reasons why it probably won’t happen.
Wall Street is designed to fool the majority, most of the time. And given the choice, I’d take the road less traveled by every time.
For some folks the golden cross (where the 50 day MA crosses above the 200 day MA) is enough to stay in the game, but volume and internals (as usual) are showing that there’s more than meets the eye.
Overall volume fell on Tuesday with our Heat Gauge firmly in the CHILLY category. What appeared like a struggle close to the aforementioned 2800 line, was actually a session controlled by the bulls… an “inside day” if you will.
In the longer term, TVO is continuing to move in an upward direction, and where volume goes prices will soon follow. This notion may seem like an obvious point to readers of this blog, but it still amazes me how few people pay attention to volume…
Which is exactly the reason why it works so well as an indicator.
End of the month profit taking may make the ride a bit bumpy, but at this point, there’s no convincing argument (from a volume perspective) to go with the obvious. -MD
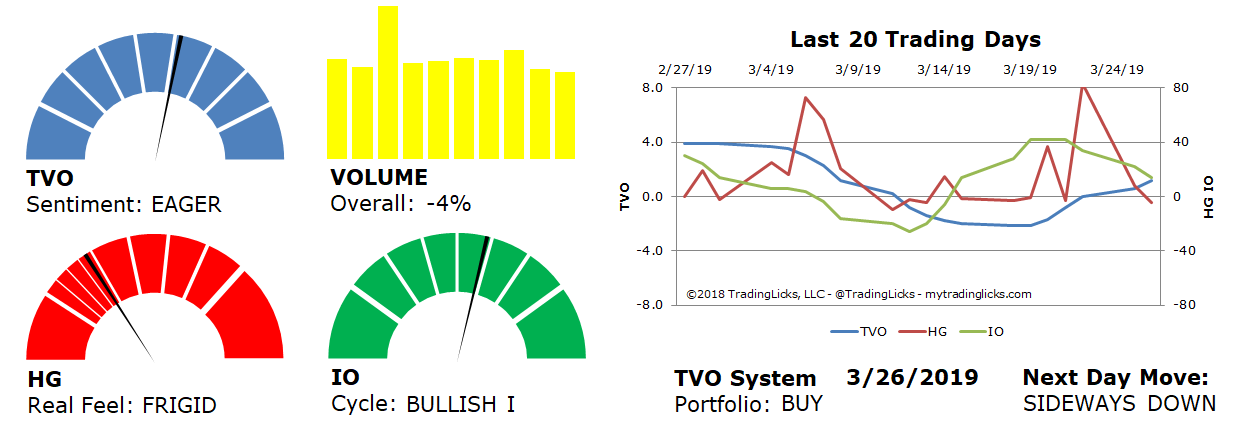
Sentiment: EAGER – Markets are in accumulation mode and big institutions are buying at a slow and steady pace.
Volume: -4% – Today’s volume was lower than the previous session.
Real Feel: FRIGID – Bulls were in control of the session with a fair amount of selling under the surface.
Cycle: BULLISH I – Retail investors are confident and slightly overweight in their holdings.
Portfolio: BUY – The market is healthy and it’s a good time to contribute to long-term investments.
Next Day Move: SIDEWAYS DOWN – The probability that SPY will close positive in the next session is 53%.
Want to read more? Join our list. It's free.
For the full rundown on today's active signals and options trades, please log in. Not a Member? Join us today.
To view past positions check out our Trade History.
To find out what the indicators mean, visit our Market Volume Volume Barometer.
To learn more about market volume and how we trade, find us on Twitter (@TradingLicks) and StockTwits!
The indicator descriptions in the above graphic represent general market sentiment. The actual TVO System signals and trades are listed below in the Members Area. To view, please Login. Not a Member? Join us.