TVO Market Barometer 12-12: It’s beginning to look a lot like… 1987?
It was once said that anyone who remembers the 80’s couldn’t possibly have been there (or maybe that was the 60’s?), but there are certain things that are hard to forget.
The first Simpsons episode and “tear down this wall” often make the 1987 nostalgia short list. But for most traders, the big one that just never seems to fade away is the “Black Monday” stock market crash in October of that year. Whether you were sporting your “Lethal Weapon” jean jacket, cruising around town on 89 cents a gallon (or playing with your “Talking Alf”), you probably have some recollection of the 22.6% drop… or you may have even traded it yourself.
And anytime the market corrects these days, just like any good old wave of nostalgia, some folks wish they could live that fateful day all over again. The desire is so strong, in fact, that all of a sudden every chart they see now seems to match up perfectly… another ’87 seems inevitable and charts can’t be wrong, right?
Well, not exactly, when you look at it from the perspective of volume.
That Black Monday drop is the one we all remember (which nearly reached a staggering 100 on our Heat Gauge, the highest ever recorded since 1978), but there were already 3 consecutive solid high volume distribution sessions that immediately preceded it. The trouble was actually brewing even before that, as big institutions were already starting to unravel with another 3 distribution days in the first week of October alone.
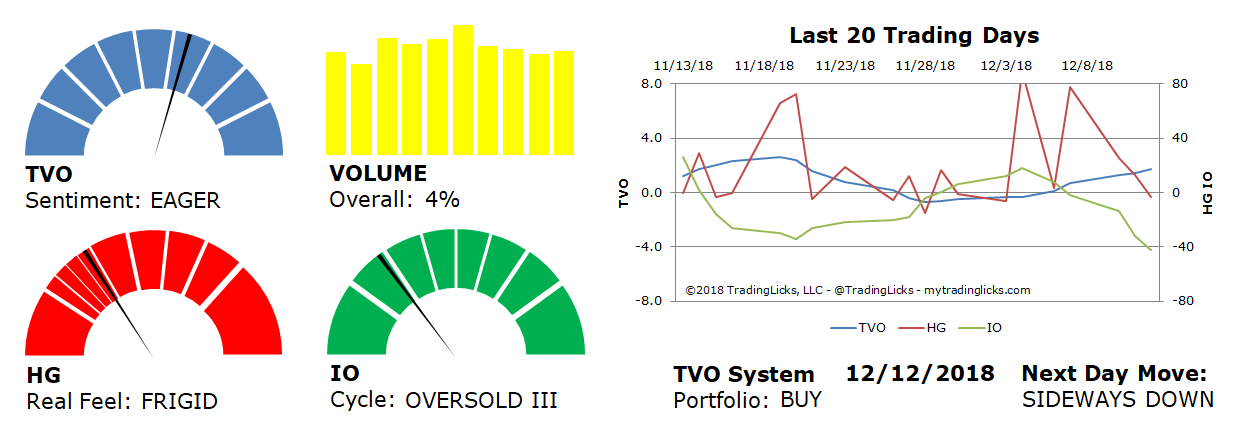
In comparison, the current 2018 tally of across-the-board distribution days since November 1st (which is already well over a month ago) is a whopping 2. We did have a pretty hot selling session on 12/4 (HG was close to 90), but overall volume has steadily decreased since then… A fact that some say is bearish, but a low volume period after exhausted high volume selling is a potential opportunity for bulls to fill the vacuum.
Whether the big boys are settling in for a long winters nap or just waiting for January to unload, remains to be seen, but there is indeed more to an “identical” price chart than meets the eye. In the meantime, while retail investors battle it out for the Santa rally, the last bit of nostalgia they feel they deserve in 2018, the best thing to do is take it as it comes, tune out the noise and trade your plan. -MD
Sentiment: EAGER – Markets are in accumulation mode and big institutions are buying at a slow and steady pace.
Volume: 4% – Today’s volume was higher than the previous session.
Real Feel: FRIGID – Bulls were in control of the session with a fair amount of selling under the surface.
Cycle: OVERSOLD III – Retail investors are running for the hills.
Portfolio: BUY – The market is healthy and it’s a good time to contribute to long-term investments.
Next Day Move: SIDEWAYS DOWN -Â The probability that SPY will close positive in the next session is 53%.
Want to read more? Join our list. It's free.
For the full rundown on today's active signals and options trades, please log in. Not a Member? Join us today.
To view past positions check out our Trade History.
To find out what the indicators mean, visit our Market Volume Volume Barometer.
To learn more about market volume and how we trade, find us on Twitter (@TradingLicks) and StockTwits!
The indicator descriptions in the above graphic represent general market sentiment. The actual TVO System signals and trades are listed below in the Members Area. To view, please Login. Not a Member? Join us.