TVO Market Barometer 4-9: Is it gap and go or look out below?
After 2 straight weeks at the 200 day MA, Monday looked like the day the S&P 500 would break away to the upside and never look back.
Except it didn’t work out that way.
Nevertheless, bulls are convinced the extended time spent at the 200 shows just how strong the institutional support is, while bears are saying the longer we stay, the surer we break support and go lower. And both sides are right in theory, but depending on the time frame, only one gets the brass ring.
We sold our SPY calls from Friday for a small gain, but we’re still holding some for the longer term. TVO is approaching -5.0 and is starting to slow down, and it’s looking like all that’s needed to break out of 200 DMA range is just one solid across-the-board accumulation day.
It’s also at this level on the oscillator where historically there’s a much greater potential for the tide to turn as sellers start to dwindle in numbers. Now more than ever is the time to tune out the fear mongers and trade what you see… and no matter which way you see it, this may be the last chance around the merry-go-round to get on board. -MD
Want to read more? Join our list. It's free.
For the full rundown on today's active signals and options trades, please log in. Not a Member? Join us today.
To view past positions check out our Trade History.
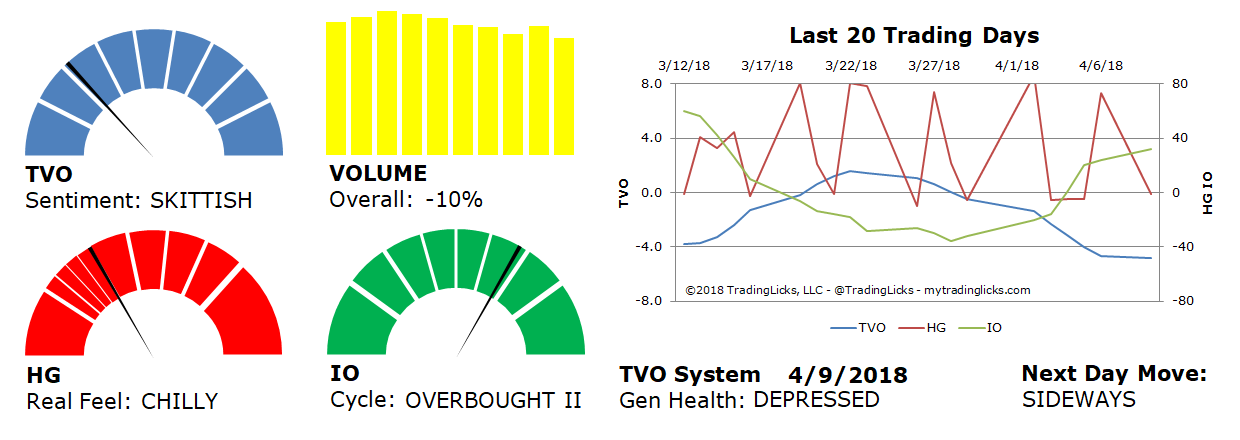
To find out what the indicators mean, visit our Market Volume Volume Barometer.
To learn more about market volume and how we trade, find us on Twitter (@TradingLicks) and StockTwits!
The indicator descriptions in the above graphic represent general market sentiment. The actual TVO System signals and trades are listed below in the Members Area. To view, please Login. Not a Member? Join us.