TVO Market Barometer 9-12: Calculated skill or a stroke of luck?

This week we closed out our 11th consecutive winning trade. That’s 2 solid months of nothing but winners for the TVO System. And the average ROI for each trade was +24%, so we’re talking about substantial gains here.
I’d be tempted to also add (like so many day trading gurus do who claim to be “crushing the market”) that TVO now has a 100% win rate… But that’s simply not the case. Our long-term win rate has consistently held at about 66%, which means that currently we’re in an unusually long, but not unprecedented winning streak. As a matter of fact, the longest recorded win streak for TVO from our backtesting results is 14 in a row.
So I’ll bet you’re asking, how do you know that isn’t just some kind of unusual stroke of luck? Well, it turns out there’s a formula for that, and our data fits right in line with probability and statistics. The formula (= ln(# of trades)/ln(win or loss rate)) tells us that in a sample of 900 trades with a 66% win rate, the longest expected winning streak is 16 and the longest losing streak is 6.
This data can be a huge advantage for a trader because if you monitor it periodically, you’ll know exactly if your system is working or not. Knowing both kinds of streaks is important, but psychologically, having an idea of your maximum losing streak during a drawdown will help keep you sane, and hopefully stop you from redesigning a perfectly good strategy.
Ok, so now you’ve got all those wins in a row… That’s probably never going to happen again, right? Well, it turns out there’s another formula that tells you just how often you can expect to have a winning streak of 5, 10, or any number of trades. That formula (=1 divided by the win or loss rate, to the power of the # of consecutive wins or losses) says that we can expect a 10 trade winning streak at least once every 64 trades, which for the TVO System is about once a year.
Now that all of these stats are calculated, it’s obvious after so many wins that the next trade is bound to be loser, correct? Not necessarily. Keep in mind that probability is based on all contributing factors being equal all of the time, which we know in the stock market is hardly ever the case. Also, the sample size (# of trades) greatly affects the accuracy of the results, so making sure you’re dealing with an ideal data sample (the subject of another post) is essential.
When it comes down to it, even though we can come close, there just isn’t anyway to know for sure which way the next trade will go, so adjusting your risk management based on where you are in the streak could cut your profits short and/or lead to catastrophic losses. “Letting it ride” after a string of gains and “knowing when to fold ’em” after a number of losses are prime examples of the gambler’s fallacy…Â the mistaken belief that, if something happens more frequently than normal during a given period, it will happen less frequently in the future and vice versa.
Luckily, all this can be avoided by simply keeping track of your stats. You’ll gain both the reassurance to stick out the losers and the confidence to sit back and enjoy the winners. The stock market may resemble a casino to some high rolling folks out there, but the level-headed players (who treat all trades equally in terms of money management) are the ones who’ll be around to play the game for years to come. -MD

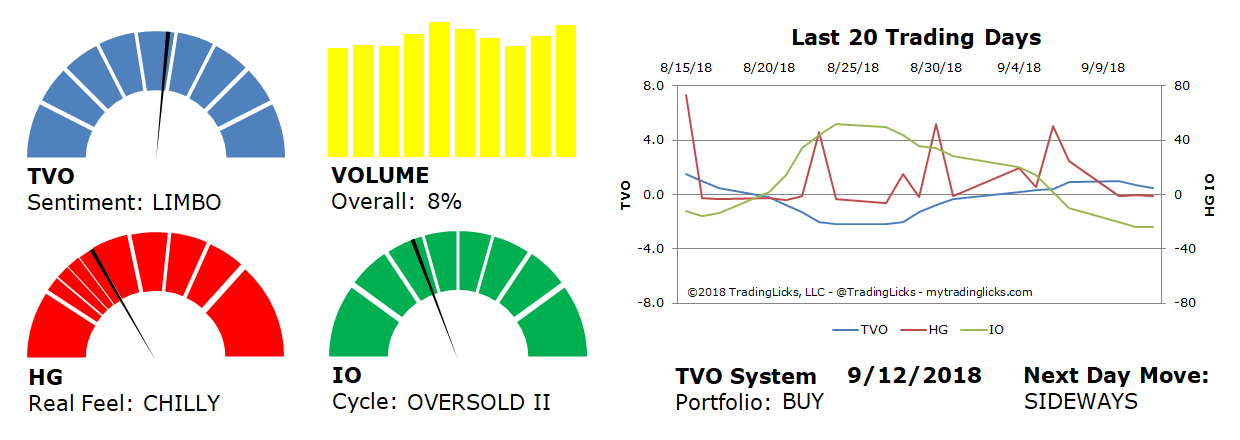
Sentiment: LIMBO – Markets are neutral and sentiment can go either way from here.
Volume: 8% – Today’s volume was higher than the previous session.
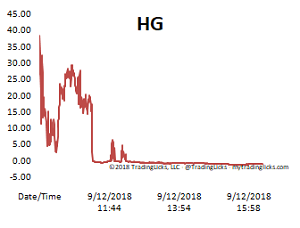
Real Feel: CHILLY – Bulls were in control of the session with substantial selling under the surface.
Cycle: OVERSOLD II – Retail investors are dumbfounded and are rapidly exiting their holdings.
Portfolio: BUY – The market is healthy and it’s a good time to contribute to long-term investments.
Next Day Move: SIDEWAYS -Â The probability that SPY will close positive in the next session is 52%.
Want to read more? Join our list. It's free.
For the full rundown on today's active signals and options trades, please log in. Not a Member? Join us today.
To view past positions check out our Trade History.
To find out what the indicators mean, visit our Market Volume Volume Barometer.
To learn more about market volume and how we trade, find us on Twitter (@TradingLicks) and StockTwits!
The indicator descriptions in the above graphic represent general market sentiment. The actual TVO System signals and trades are listed below in the Members Area. To view, please Login. Not a Member? Join us.
